
 ParticipantsReady
We’re going to Web Summit. It’s one of the biggest tech conferences in the world: tens of thousands of visitors, thousands of startups and three days of stages, in Lisbon from 10 to 12 November. We spent a rainy Sunday afternoon before the conference digging into the data, because graphs are fun and we were bored. If you’re there and you want to talk about data, book a slot or find me in the Web Summit app. I’m the one with the dataset.
Find Paul in the Web Summit app
Connect on LinkedIn
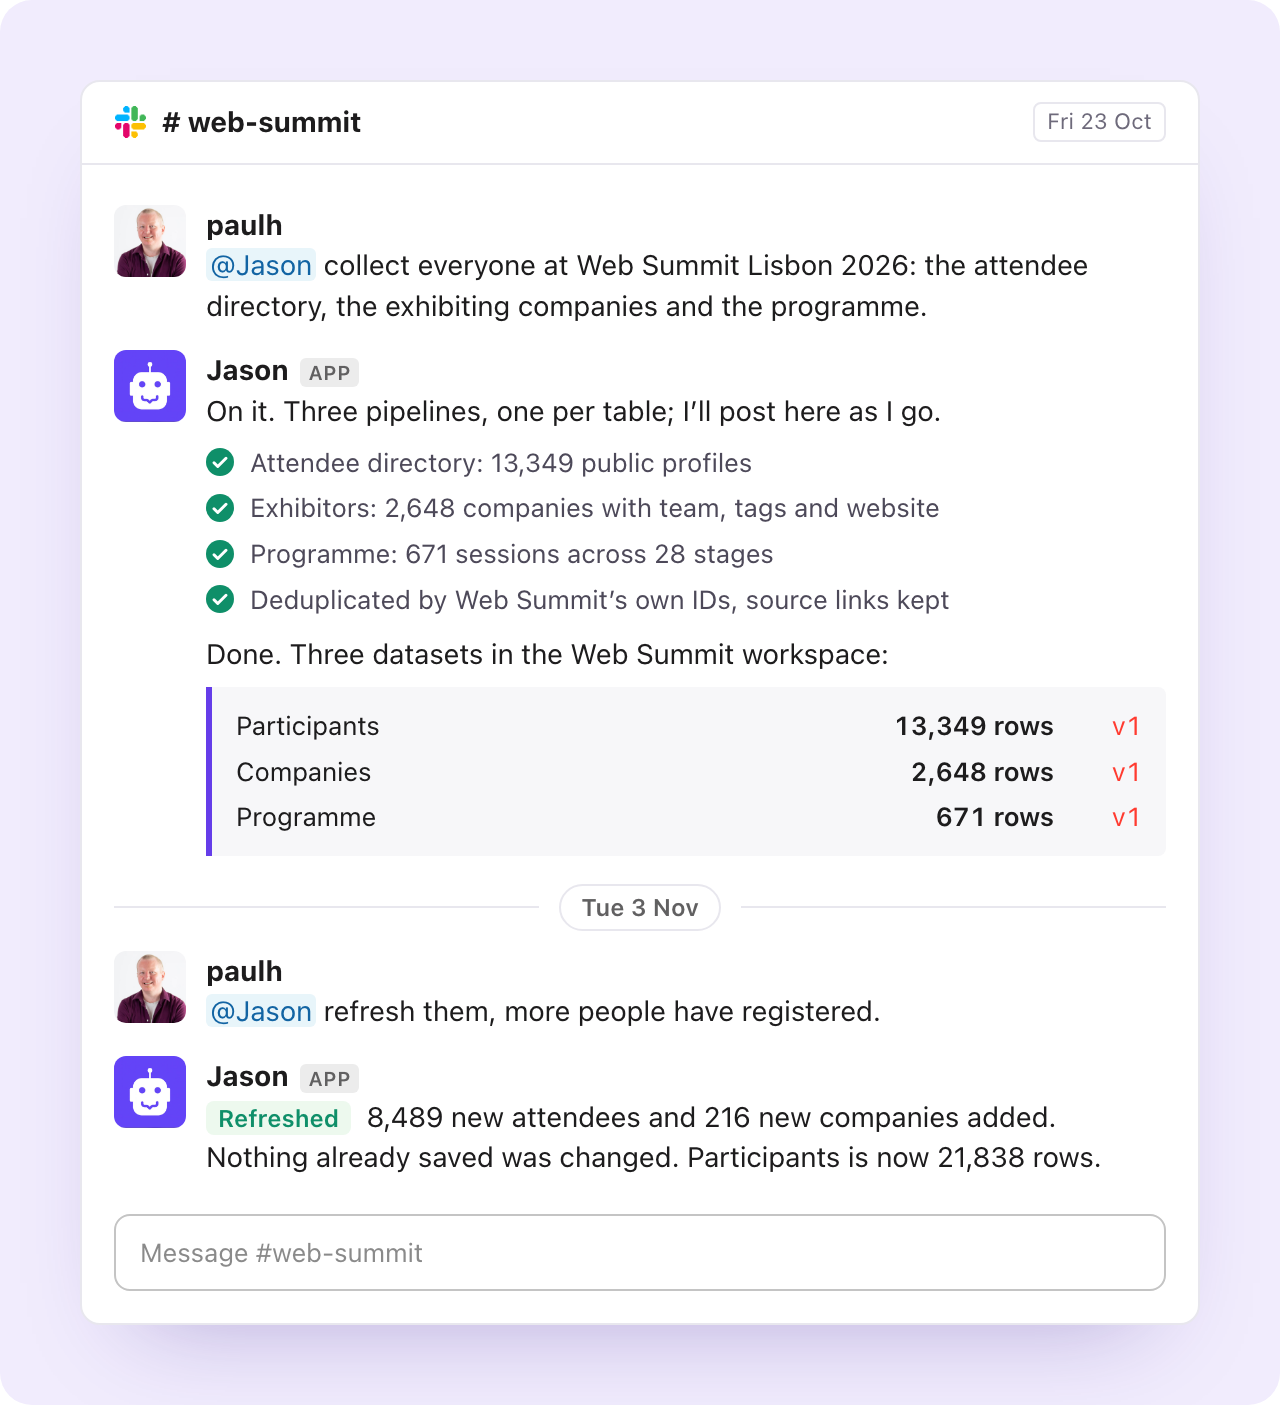
Web Summit publishes a lot of data: every attendee who opts into the directory, every exhibiting startup, every session on every stage. Nobody reads it, because it’s 22,000 profile cards behind a search box. And despite being a tech conference in 2026, Web Summit doesn’t have an MCP server. So we asked Jason, our AI data engineer, to read the whole thing and turn it into three tables.
That was the entire brief. One Slack message on a Friday morning, three datasets by lunch.
This post is what we found. The methodology is at the end, including what we didn’t collect and what we’re not publishing.
The crowd
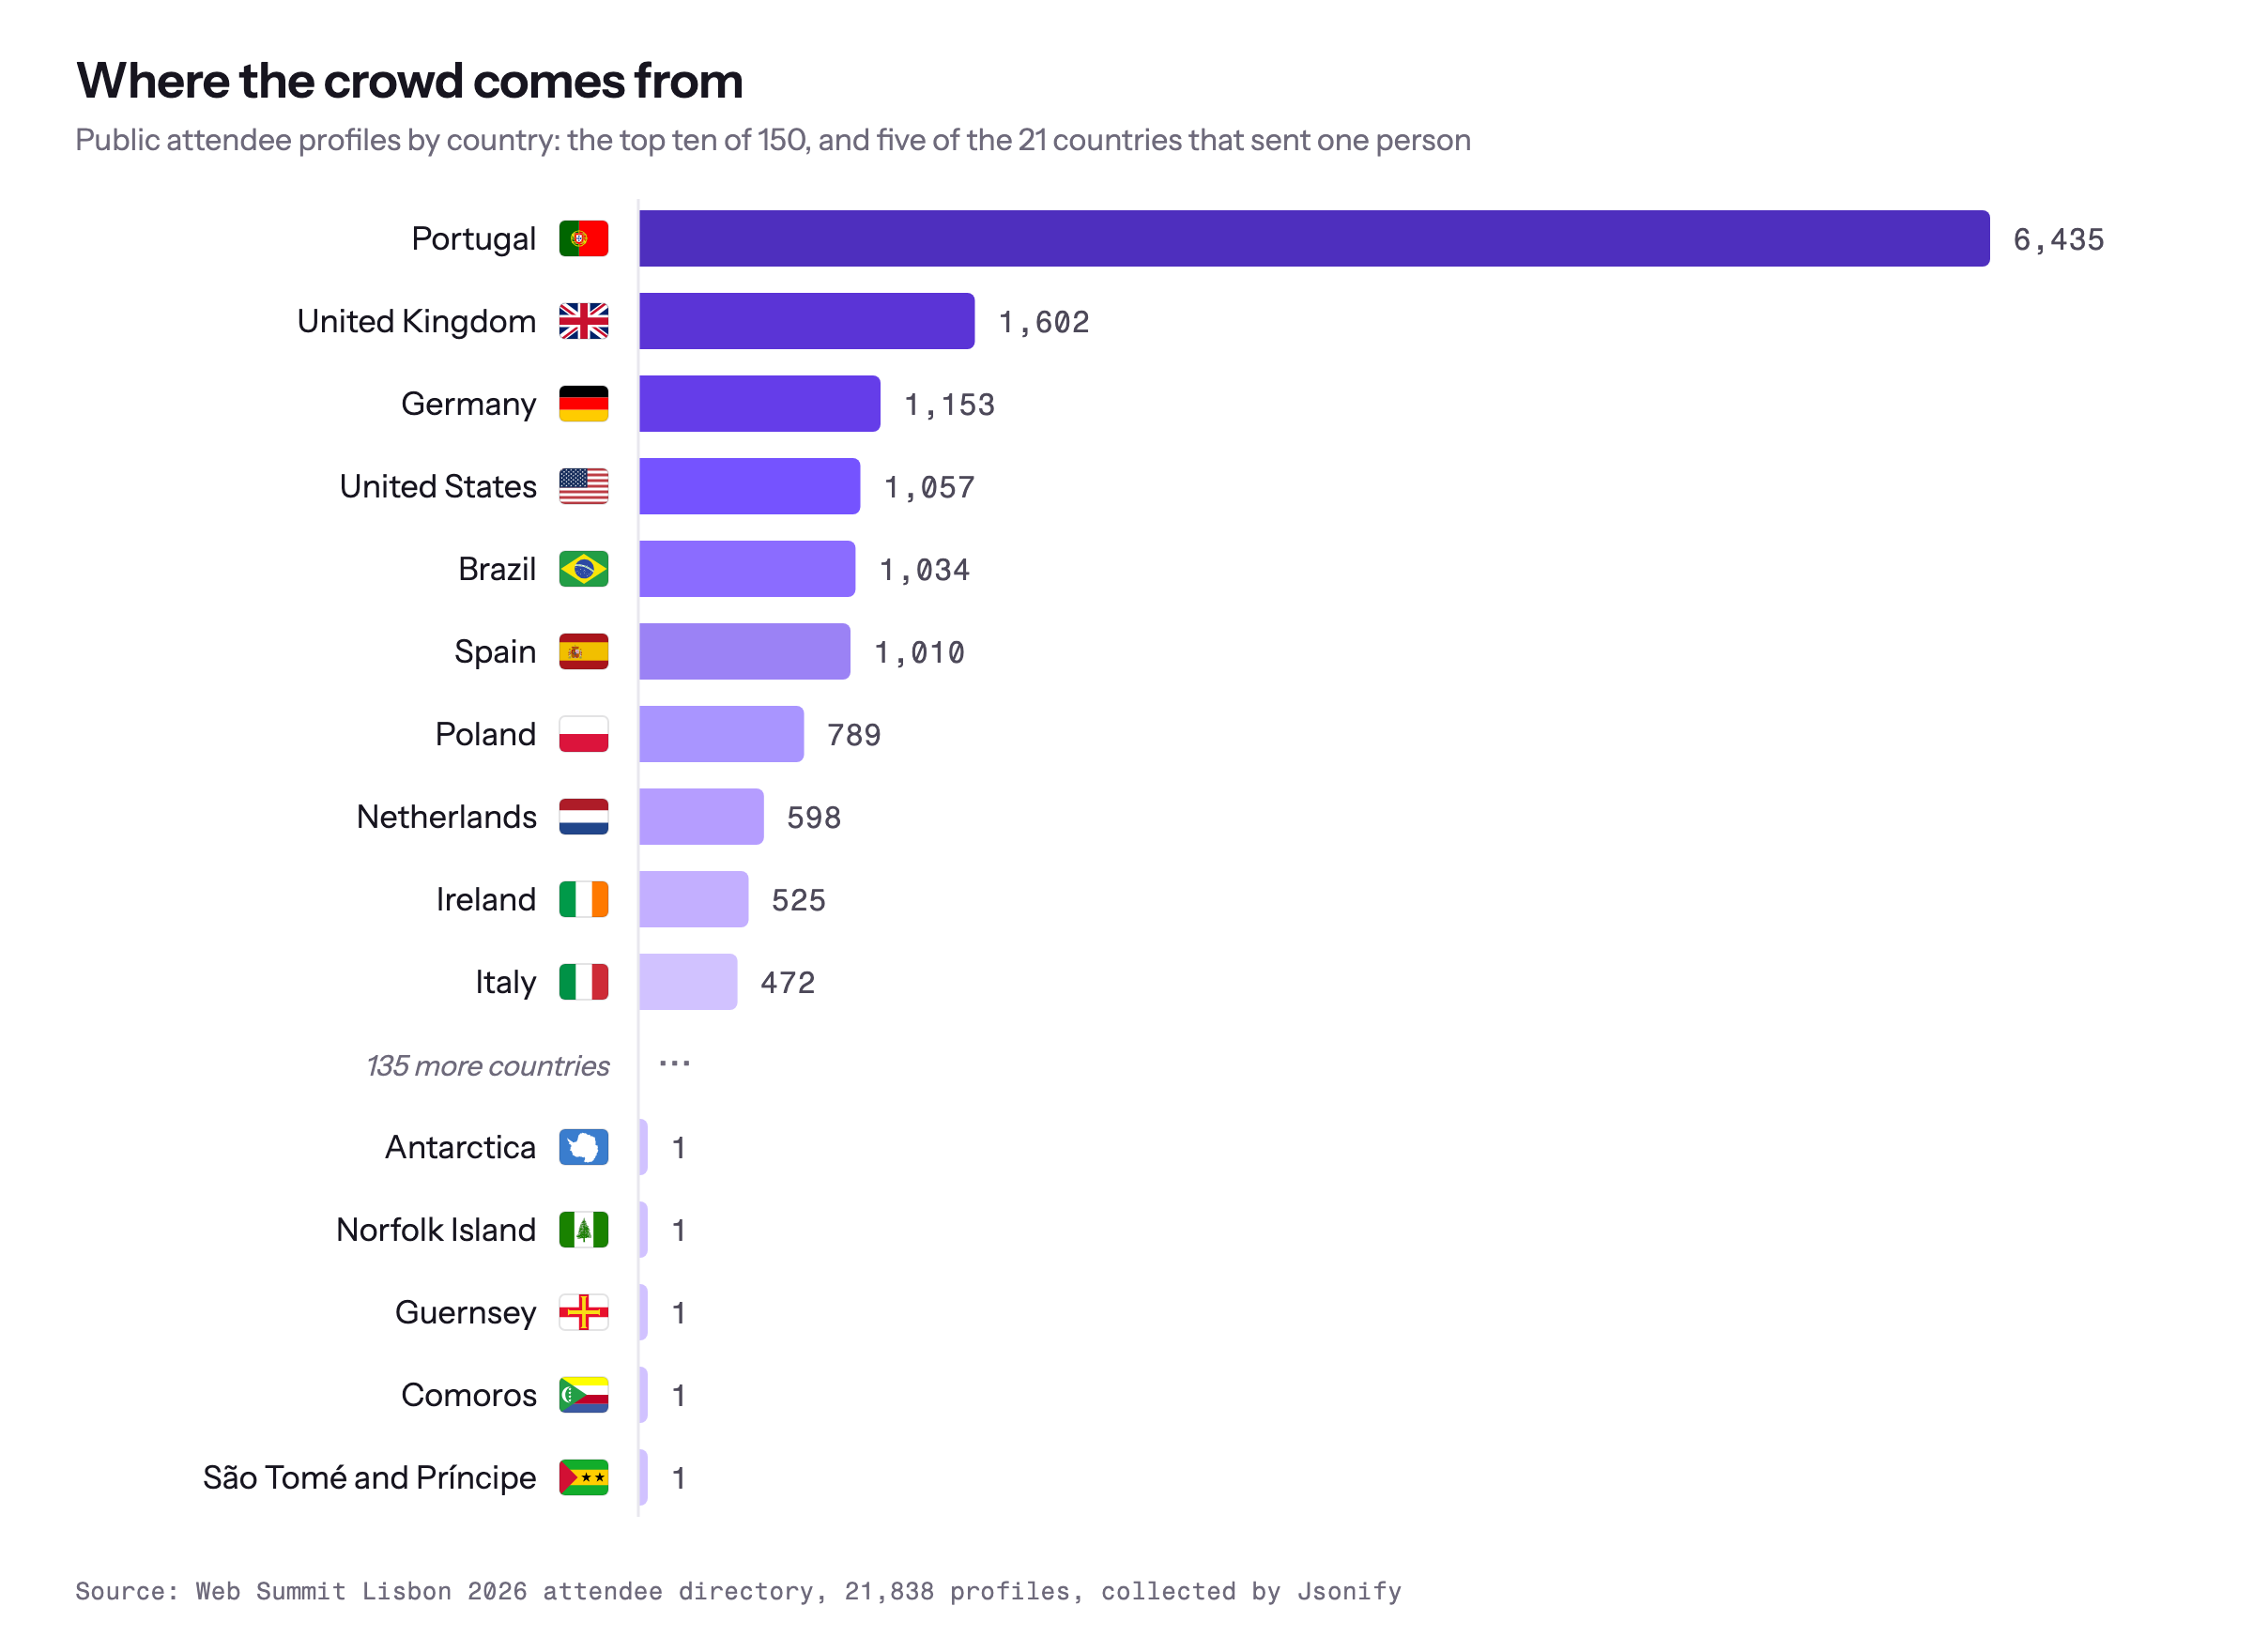
The public directory had 21,838 attendee profiles when we last refreshed it, from 150 countries. It’s a Portuguese event with an international layer on top: 29% of profiles are from Portugal, and the UK, Germany, the US and Brazil follow with around 1,000 to 1,600 each.
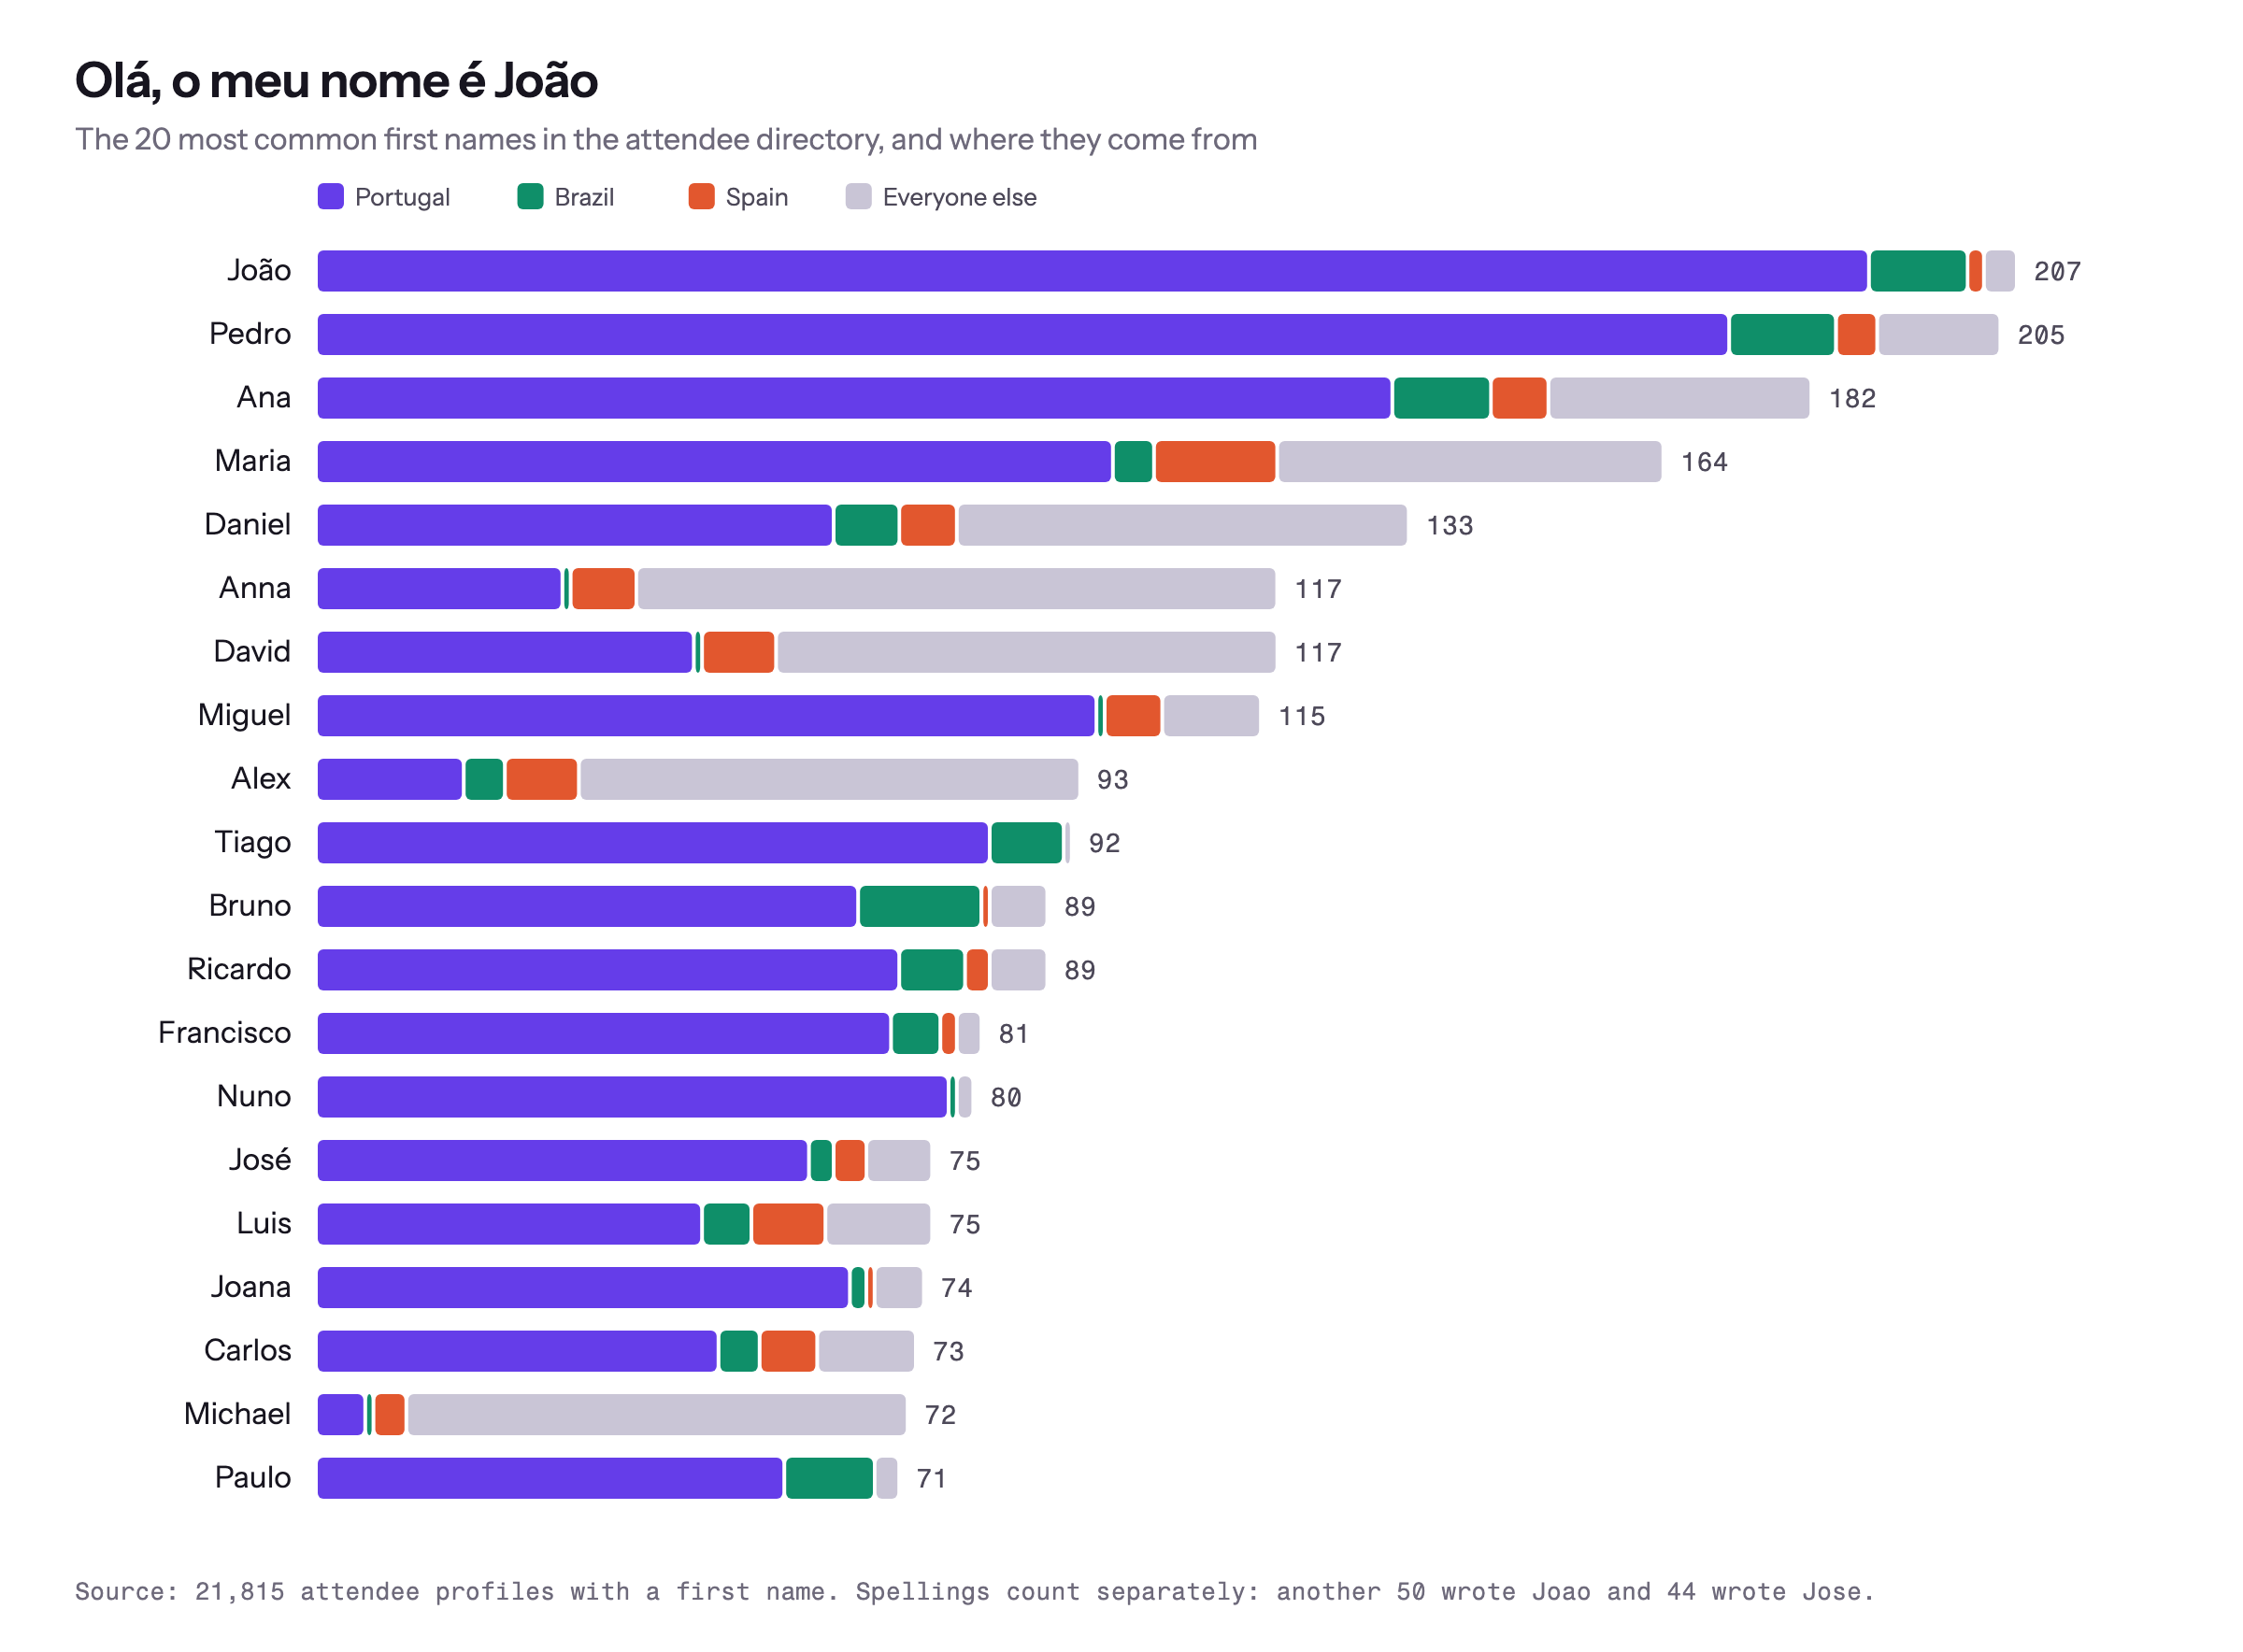
It shows in the first names. João is the most common first name in the room (207), one ahead of Pedro (205). Ana and Maria complete the top four before you reach a Daniel.
One name per country: Brazil sends Lucas, Ukraine Kateryna, Italy is split between Matteo and Andrea. The most common first name among British attendees is Paul, and it is Paul in Ireland too. There are 25 of us, so that narrows it down less than you’d hope.
At the other end, 21 countries have exactly one attendee in the directory, from Uganda to Paraguay to Guernsey, and one profile lists Antarctica as its country. Two list North Korea. 56 of the 150 countries have five people or fewer.
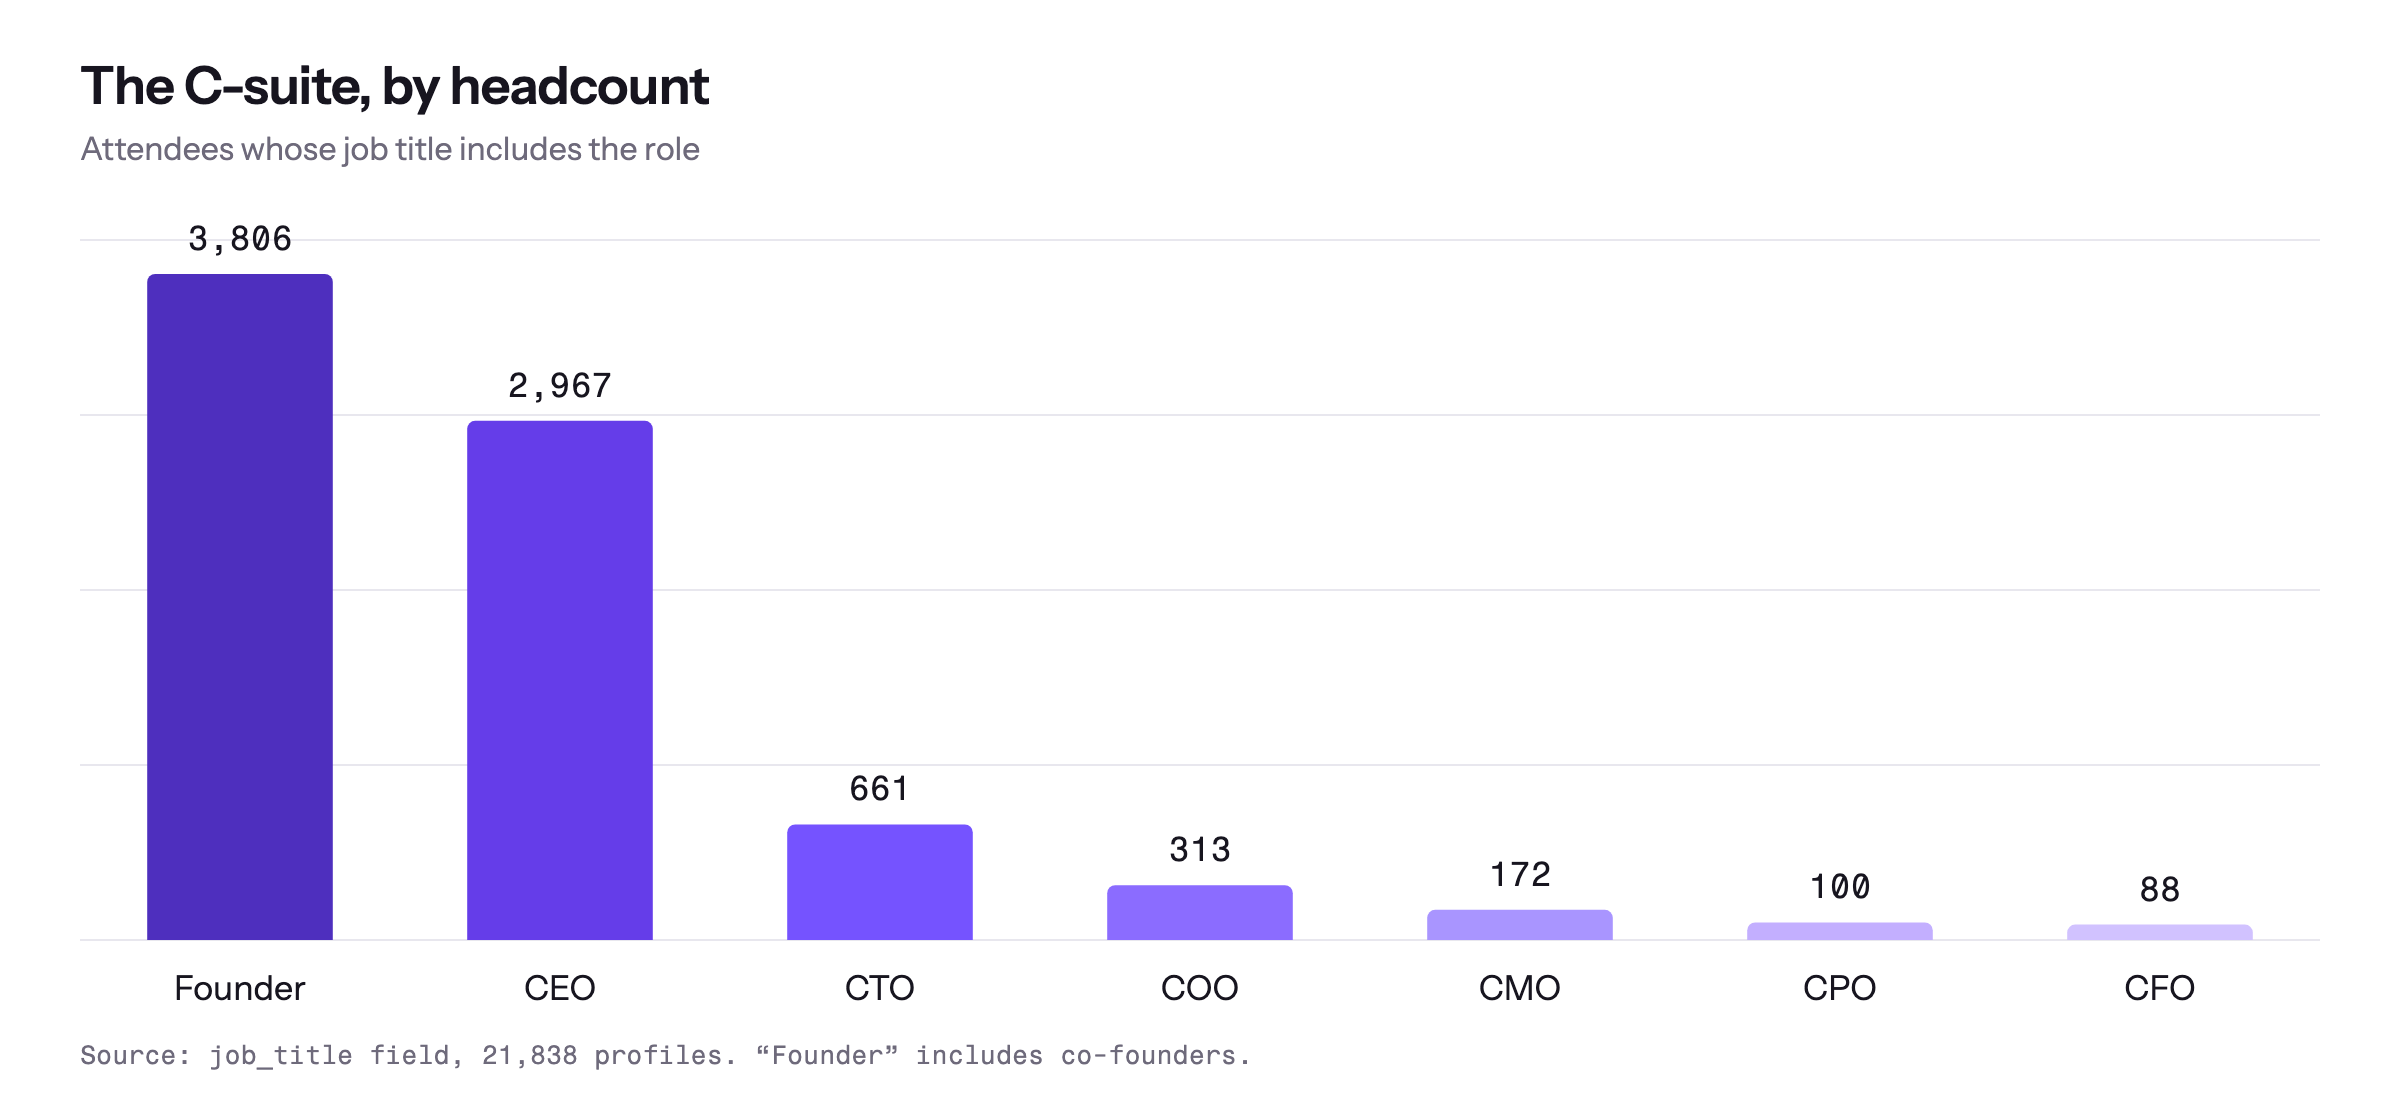
Now the job titles. There are 3,806 founders and 2,967 CEOs. There are 88 CFOs. That is roughly 34 CEOs for every CFO, which is either a statement about who gets sent to conferences or about who is doing the accounts.
Below the C-suite, who gets sent changes with the passport. We sorted job titles into technical (engineering, product, data, design) and commercial (sales, marketing, business development), founders and CEOs aside. Austria and Portugal send four technical people for every commercial one. The United States is the only country that sends more sellers than builders. The UK, France and Spain sit in between at roughly four to three.
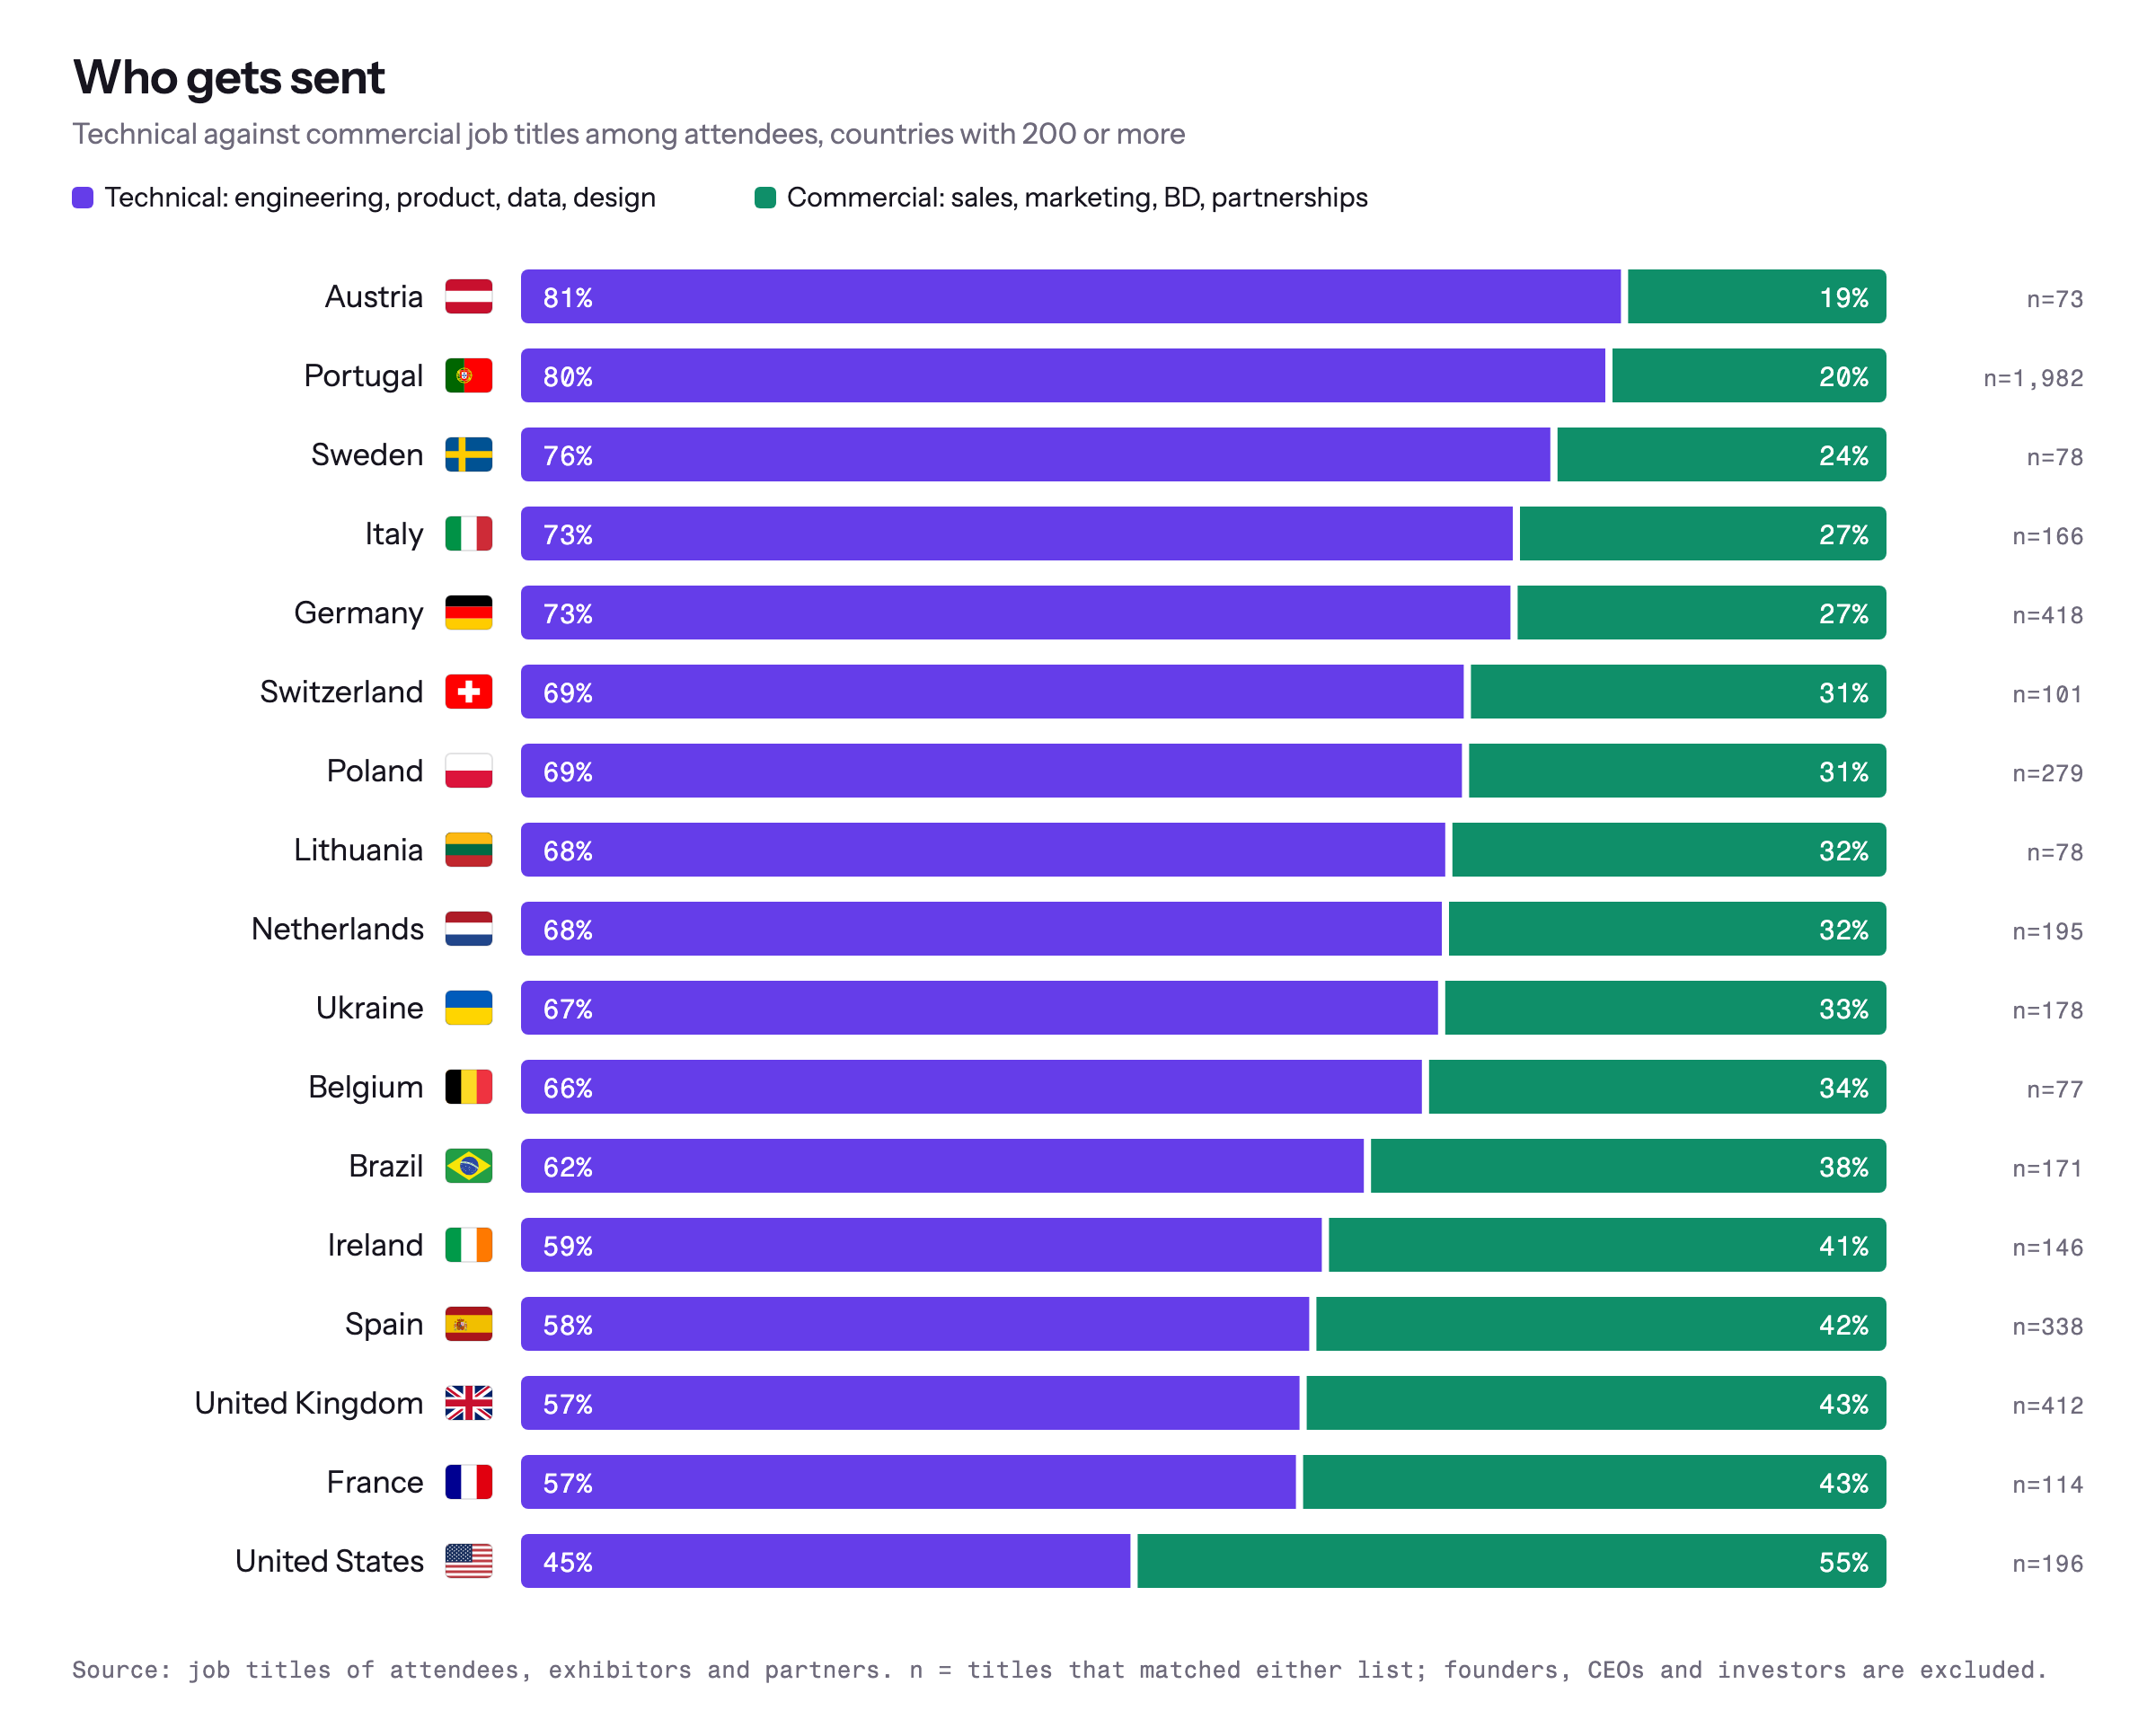
Our reading: the countries that send engineers are here to look at tooling, the countries that send sales teams are here to sell it. If you’re pitching an American stand, expect to be asked for the business case before the demo.
What do 21,823 people write about themselves when given a text box? Software, marketing, engineering, growth and co-founder, mostly. Strip out the job words and “ideas”, “connecting”, “curious” and “impact” are what’s left. And the bios have accents.
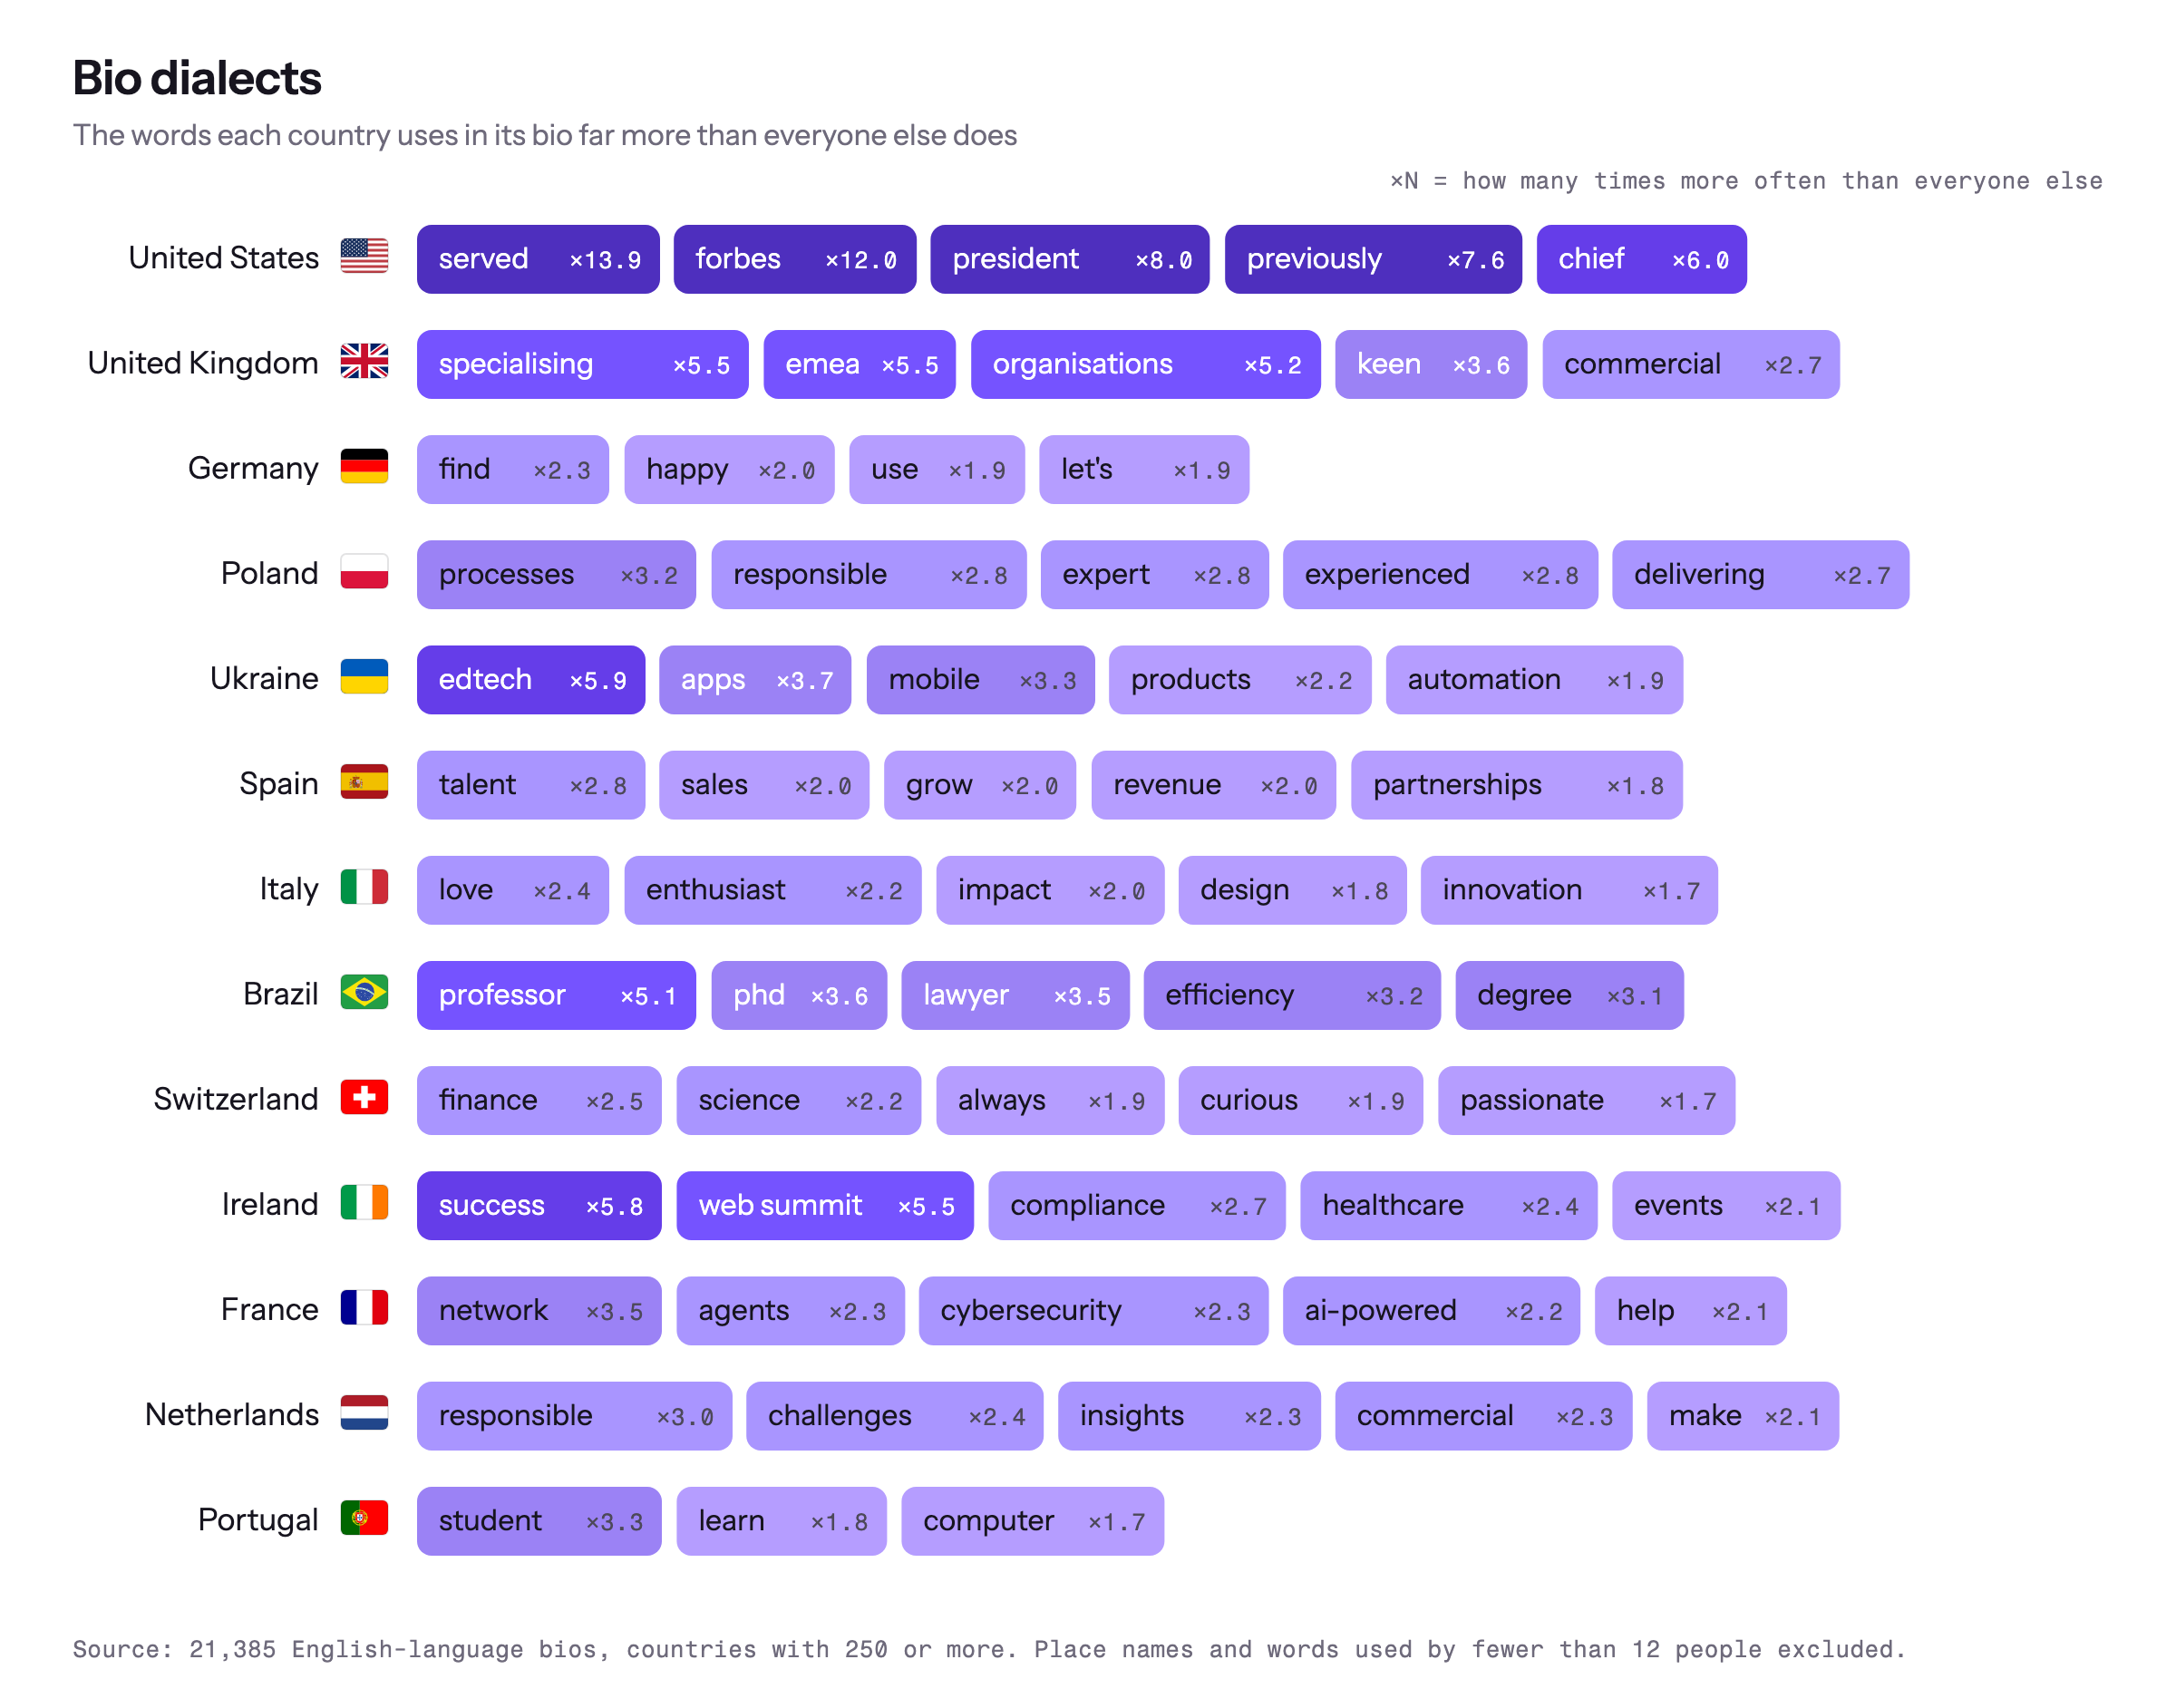
For each country we kept the words it uses far more often than everyone else does. Americans write résumés. “Served” is 14 times more common in an American bio, “Forbes” 12 times, “president”, “previously” and “chief” six to eight. The British spell it their way: “specialising”, “organisations”, “EMEA”, then “keen”. Germans write invitations: “happy”, “let’s”, “find”. Poles write competence, Ukrainians write product, Brazilians write credentials. Ireland’s two most distinctive words are “Web” and “Summit”, because this is the organiser’s staff. Portugal’s are “student” and “learn”.
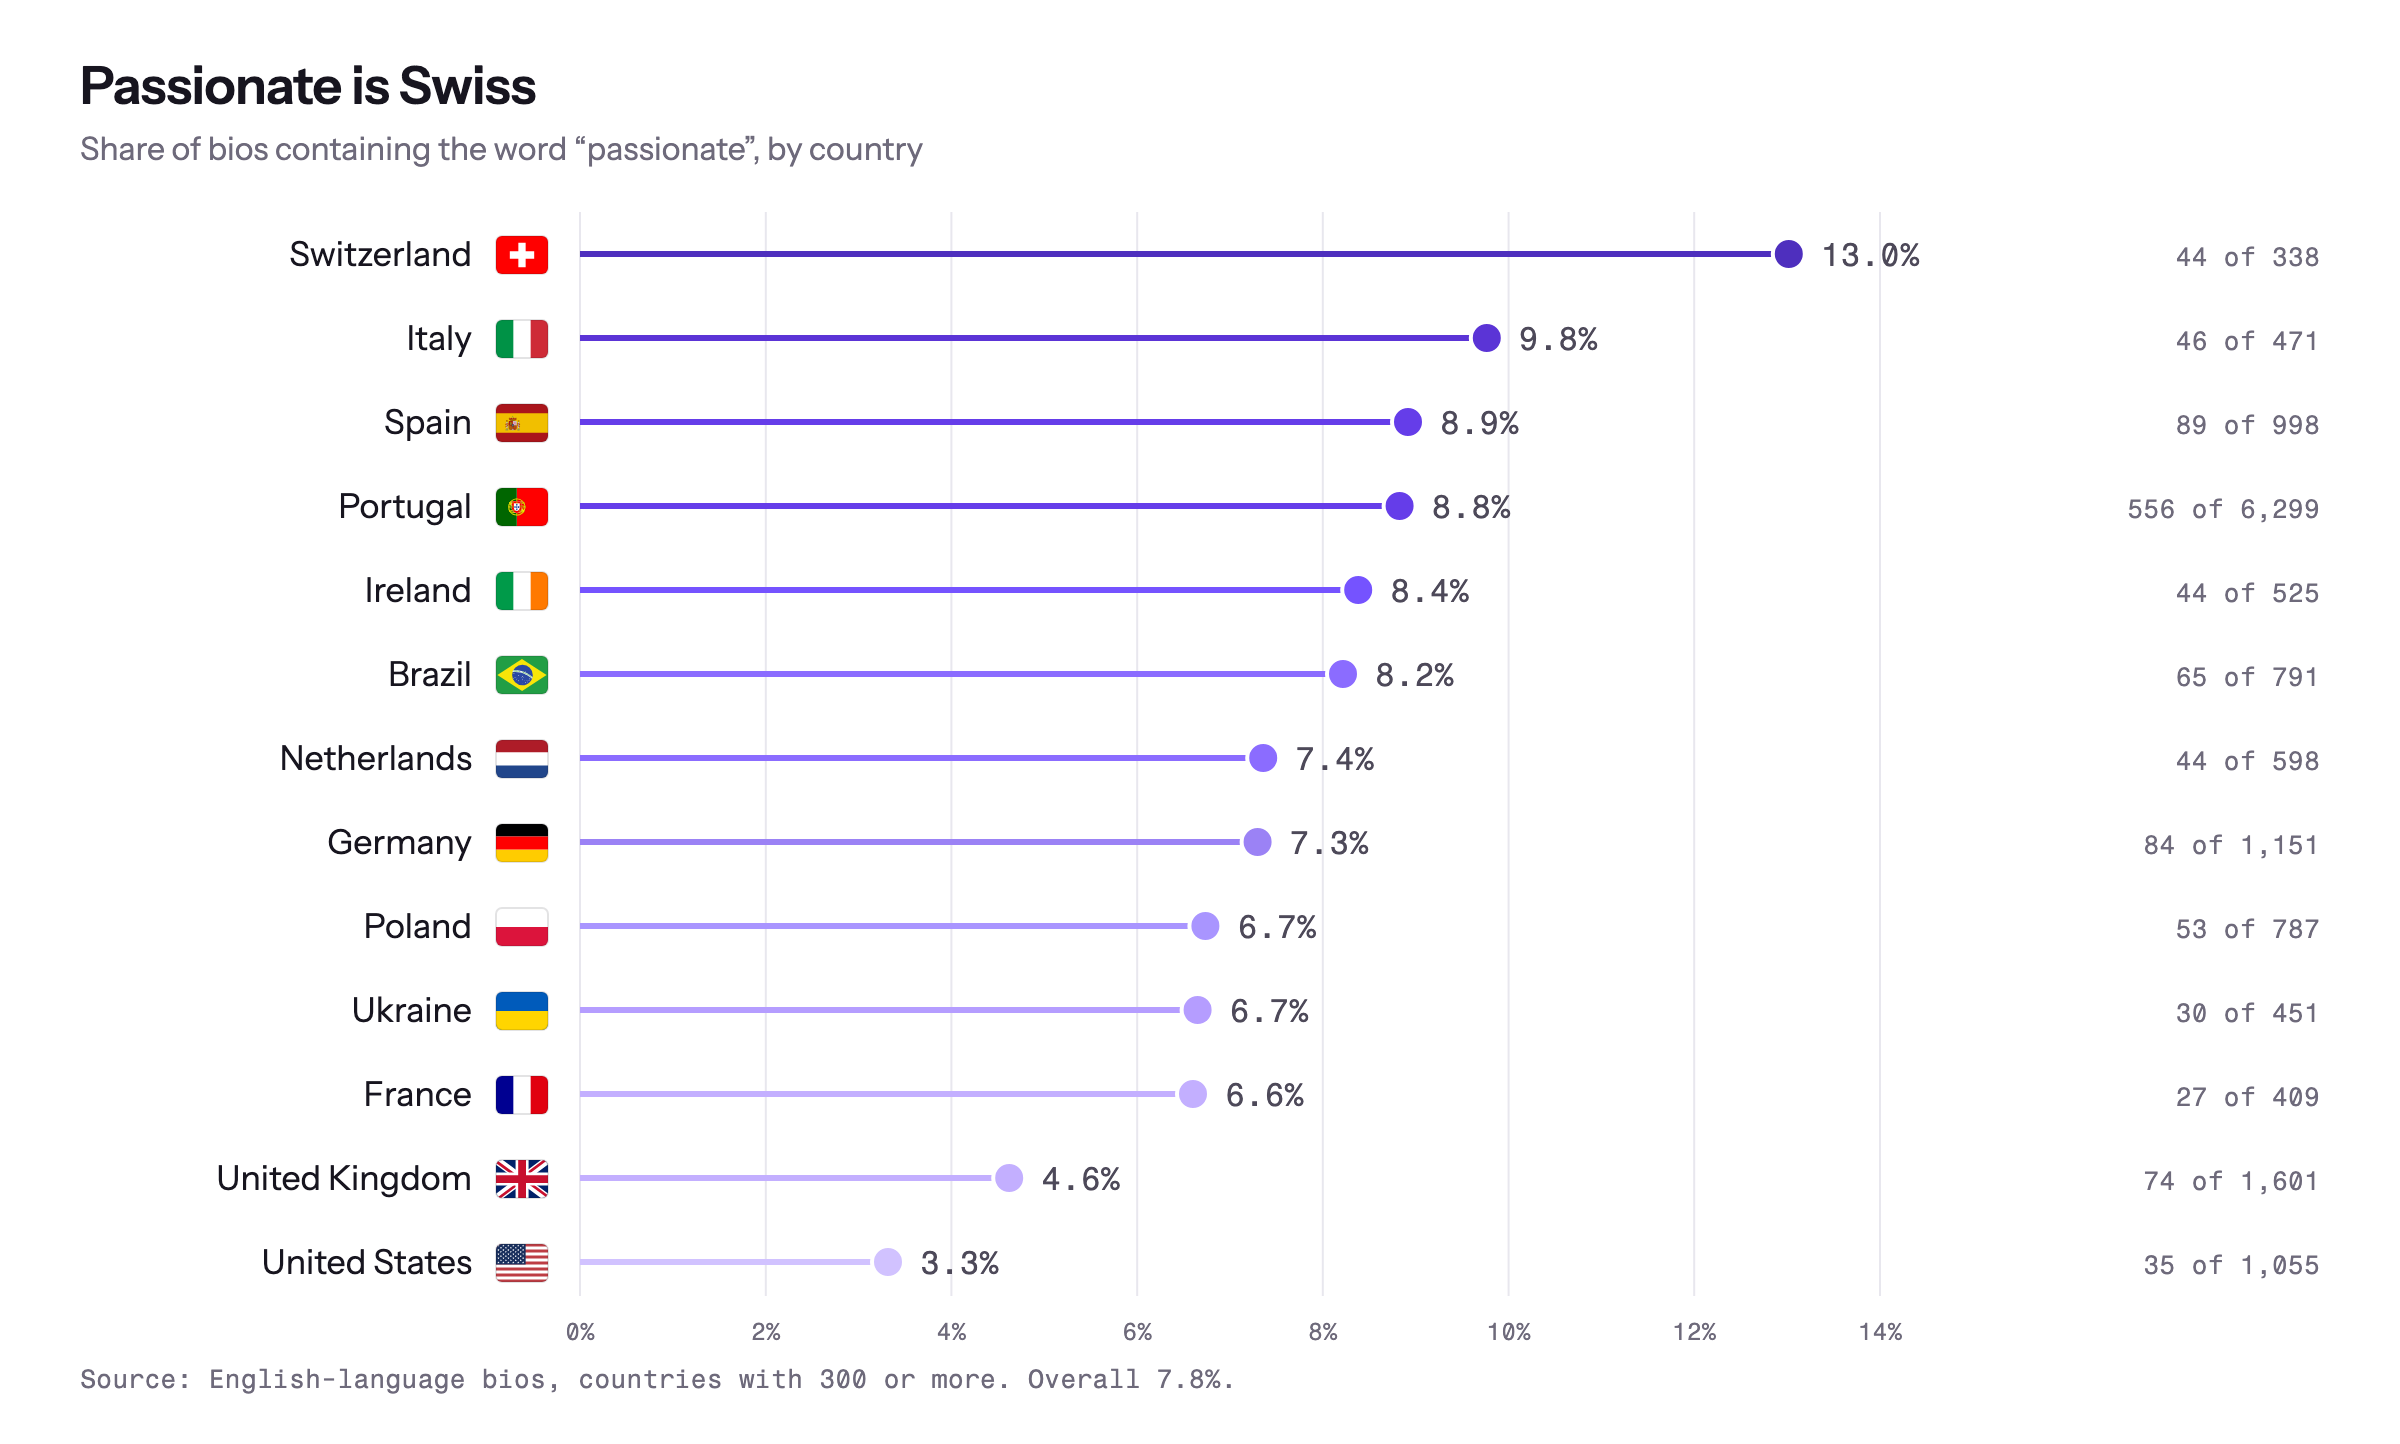
One word on its own. “Passionate” would have been the biggest word in any cloud of the bios: it appears in 1,703 bios, one in thirteen. Passionate is Swiss: 13% of Swiss attendees use the word, against 3% of Americans and 5% of Brits, with everyone else in a band between 7% and 10%.
A few more from the biographies:
- Forty-four bios contain the word visionary. Ninety-seven say serial entrepreneur. Only 27 people call themselves a ninja, guru, wizard or evangelist. The genre is dying out.
- 104 bios mention coffee and 27 mention surfing. This is Lisbon.
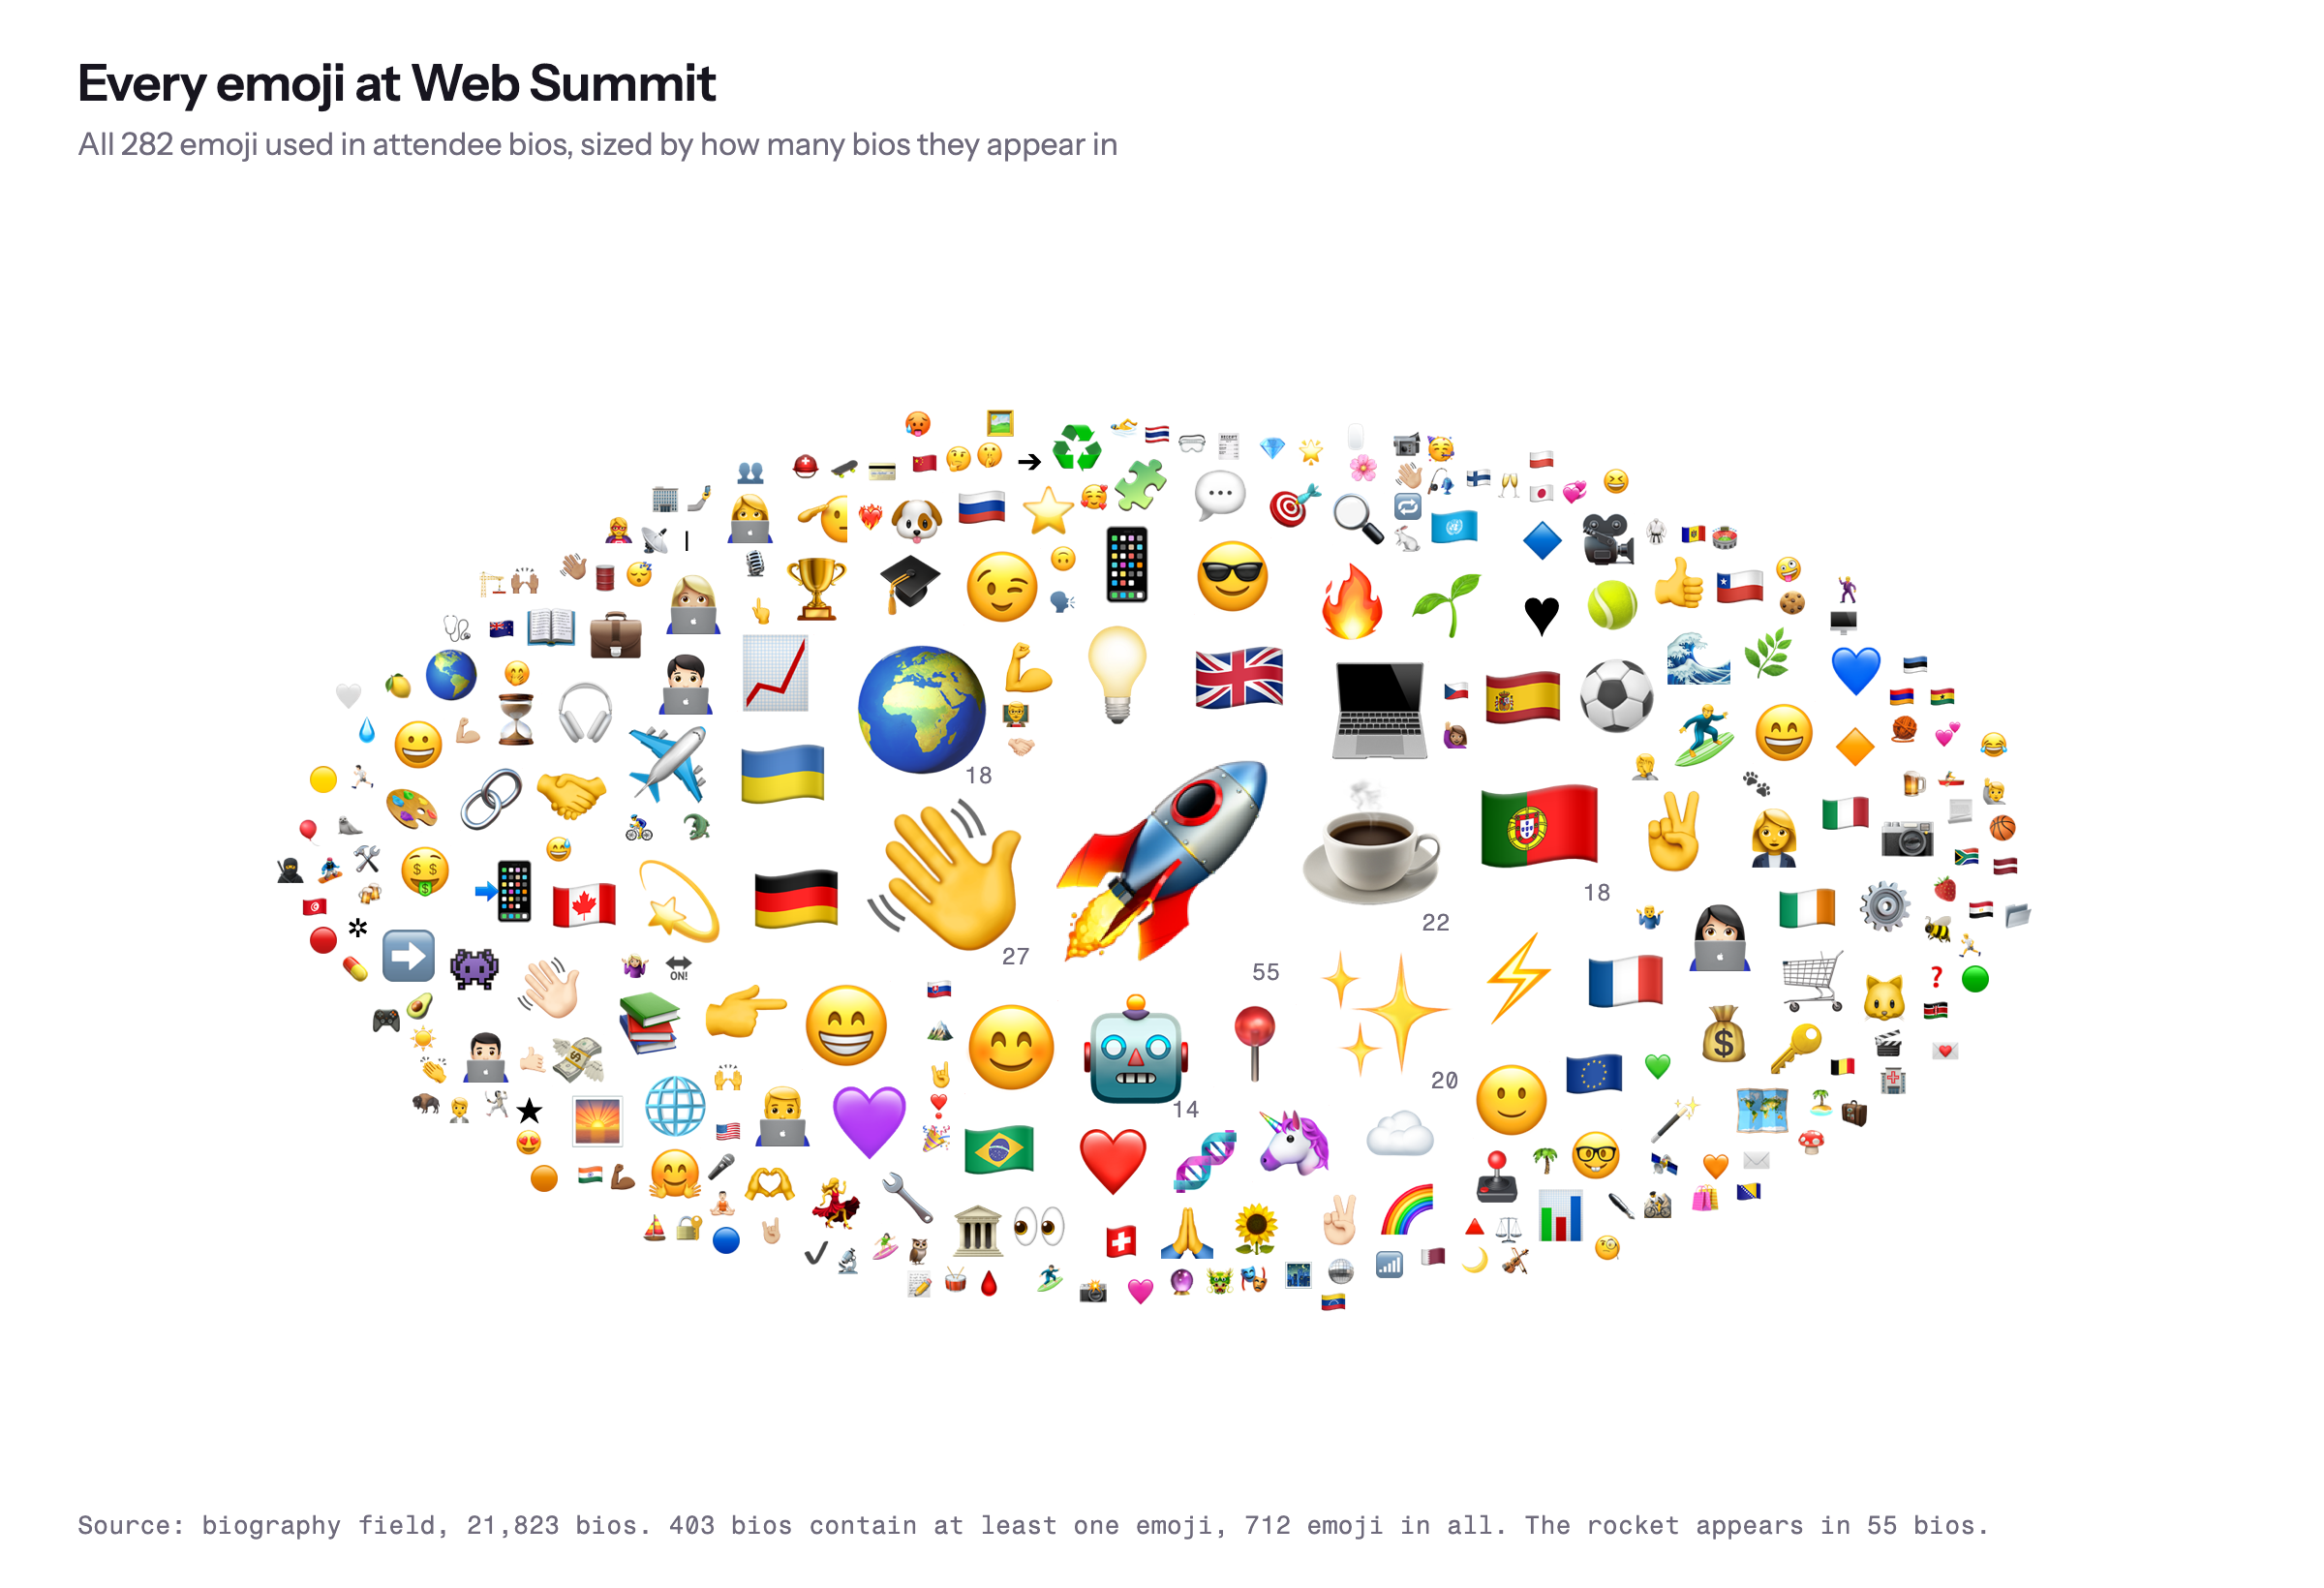
- 403 bios contain an emoji, 712 emoji in all. Fifty-five of them are rockets. Ukraine leads at 4% of bios, the US is at zero.
The rocket wins, as it does everywhere in startup land, with the wave, the coffee cup and the Portuguese flag behind it. Then a long tail: 282 different emoji, most used by exactly one person.
The startups
2,604 startups are exhibiting, across Web Summit’s Alpha, Beta and Growth tiers, from 99 countries. The UK edges Portugal here (321 to 315), then Brazil, the US, Germany and Spain.
Most of them are early. Of the startups that stated a revenue band, 40% are pre-revenue and another 39% are under $100,000 a year. Ninety-nine say they make more than a million. 54% say they’re actively fundraising.
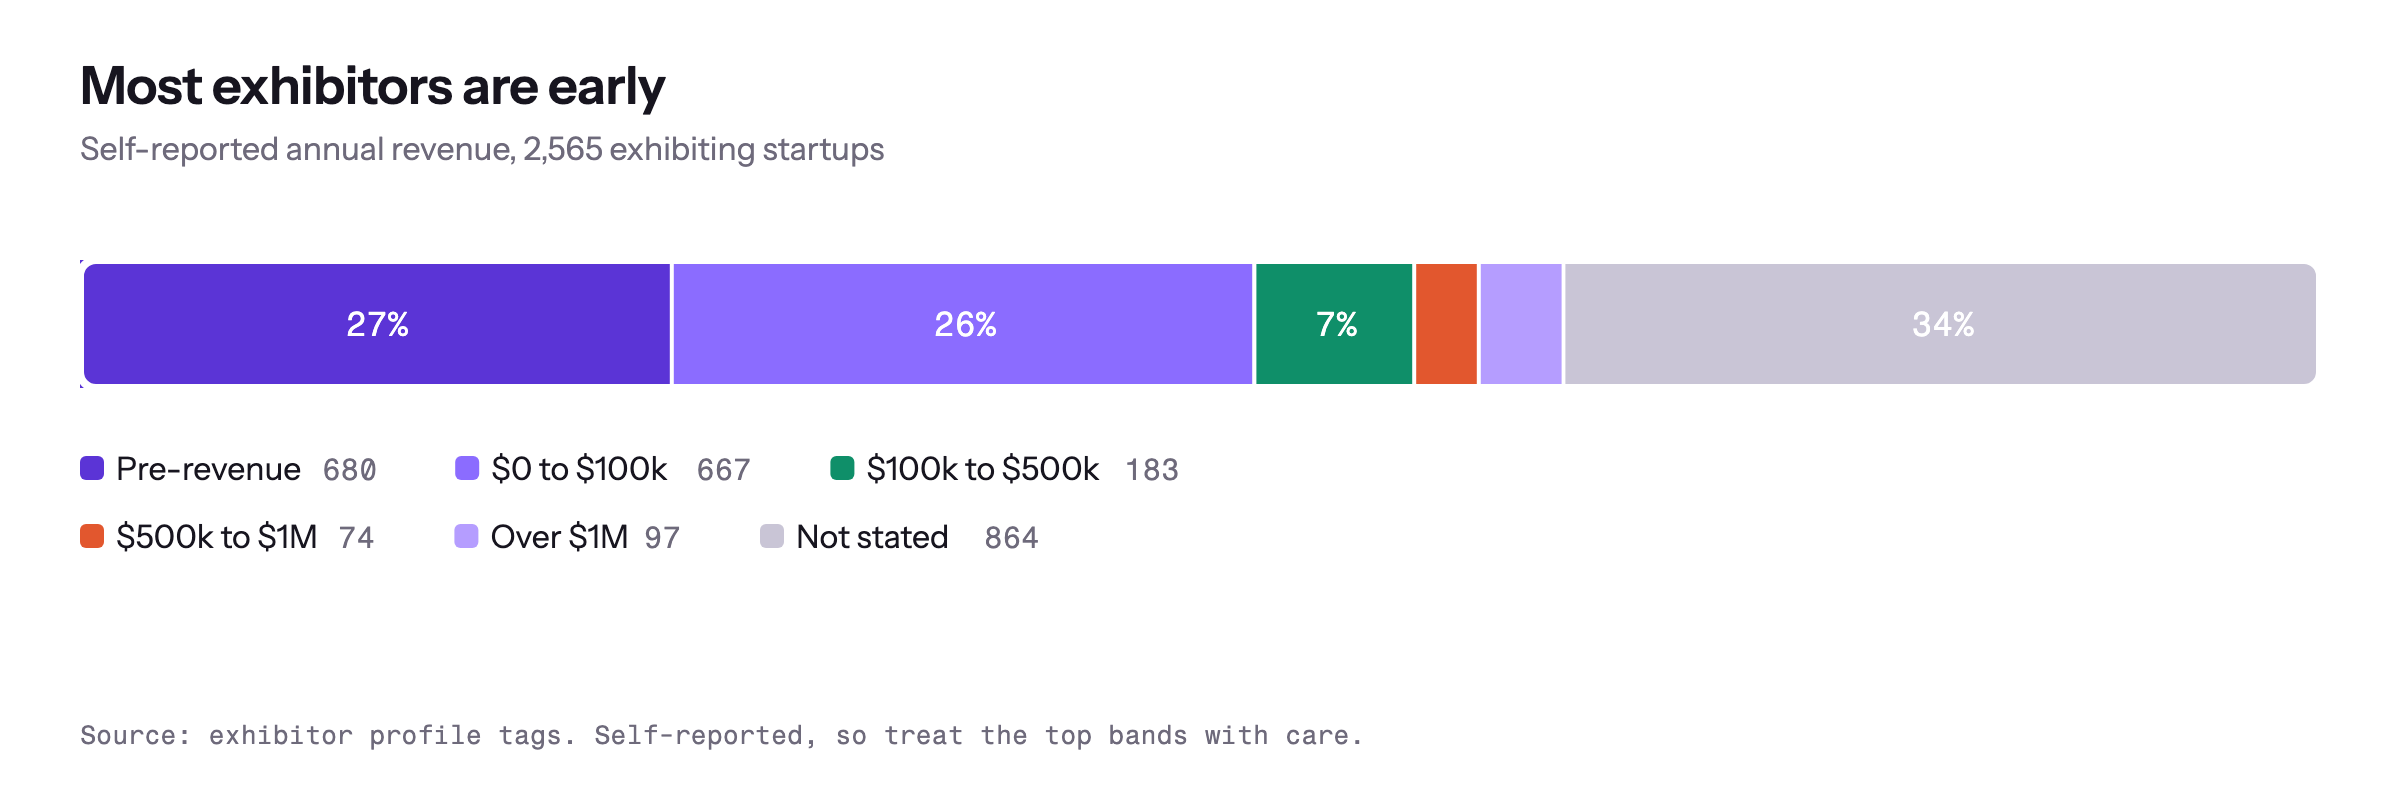
The average team listed on a stand is 1.85 people. Over a thousand startups are bringing one.
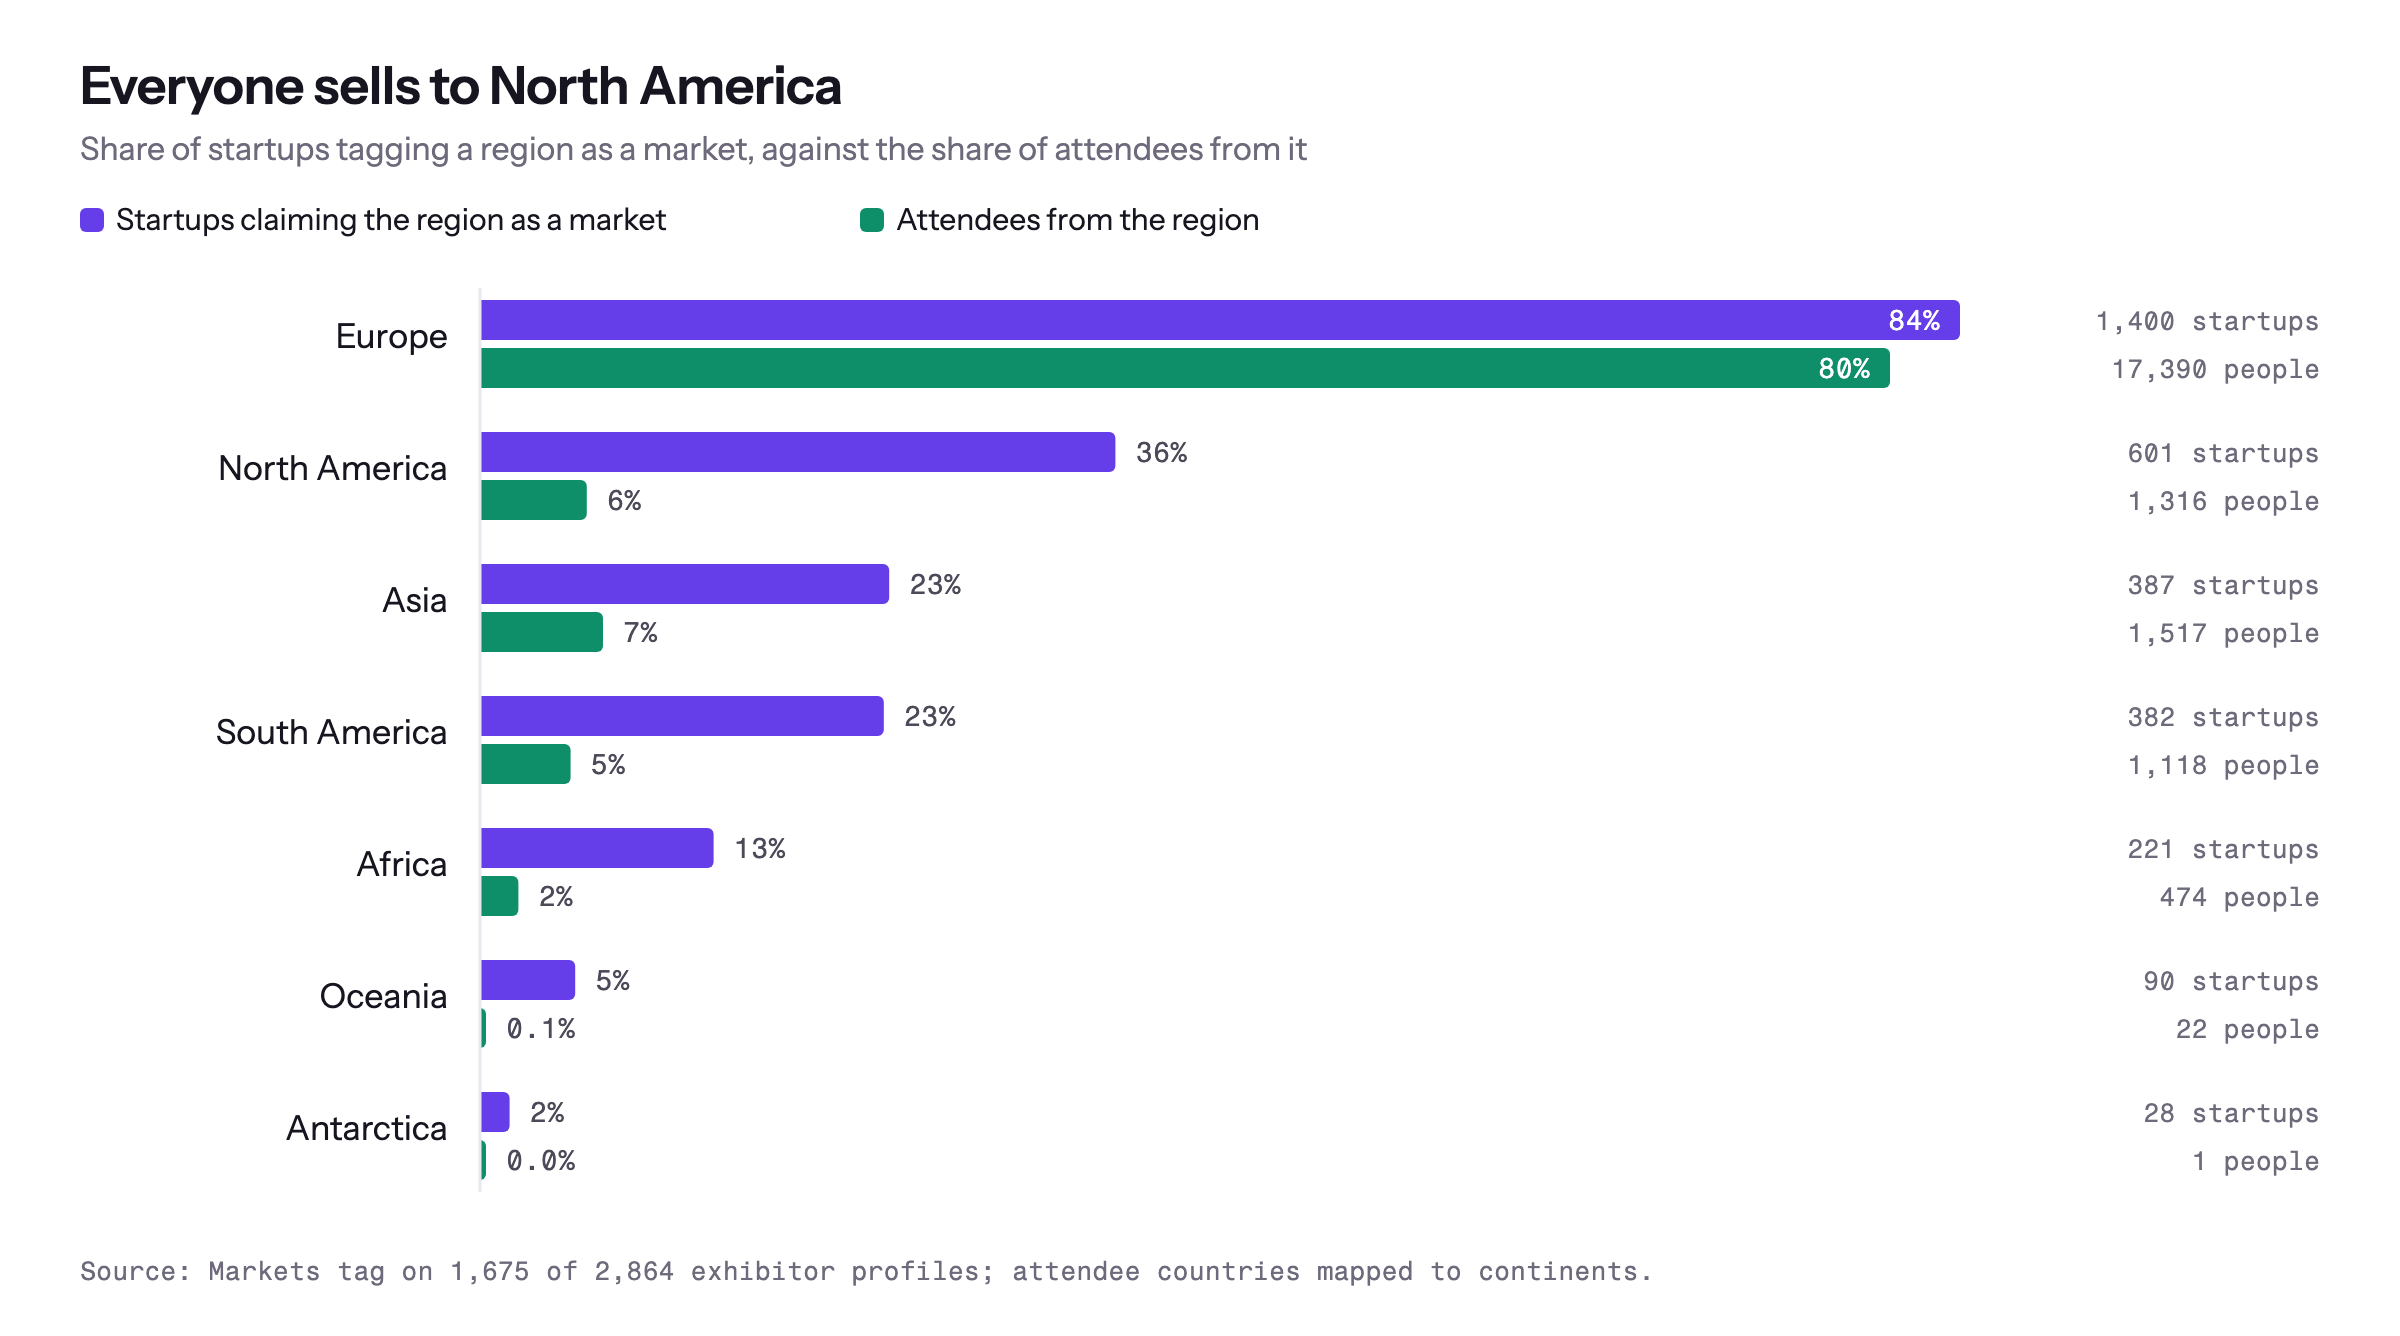
Where they say they sell: Web Summit asks each startup to tick the continents it serves, and 1,696 did. 83% ticked Europe, where 80% of the room is from. 36% ticked North America, where 6% of the room is from. Oceania is claimed by 90 startups and sent 22 people. Fifty-three ticked all six inhabited continents, and 28 ticked Antarctica. One attendee lists Antarctica as their country, so at least they have a lead.
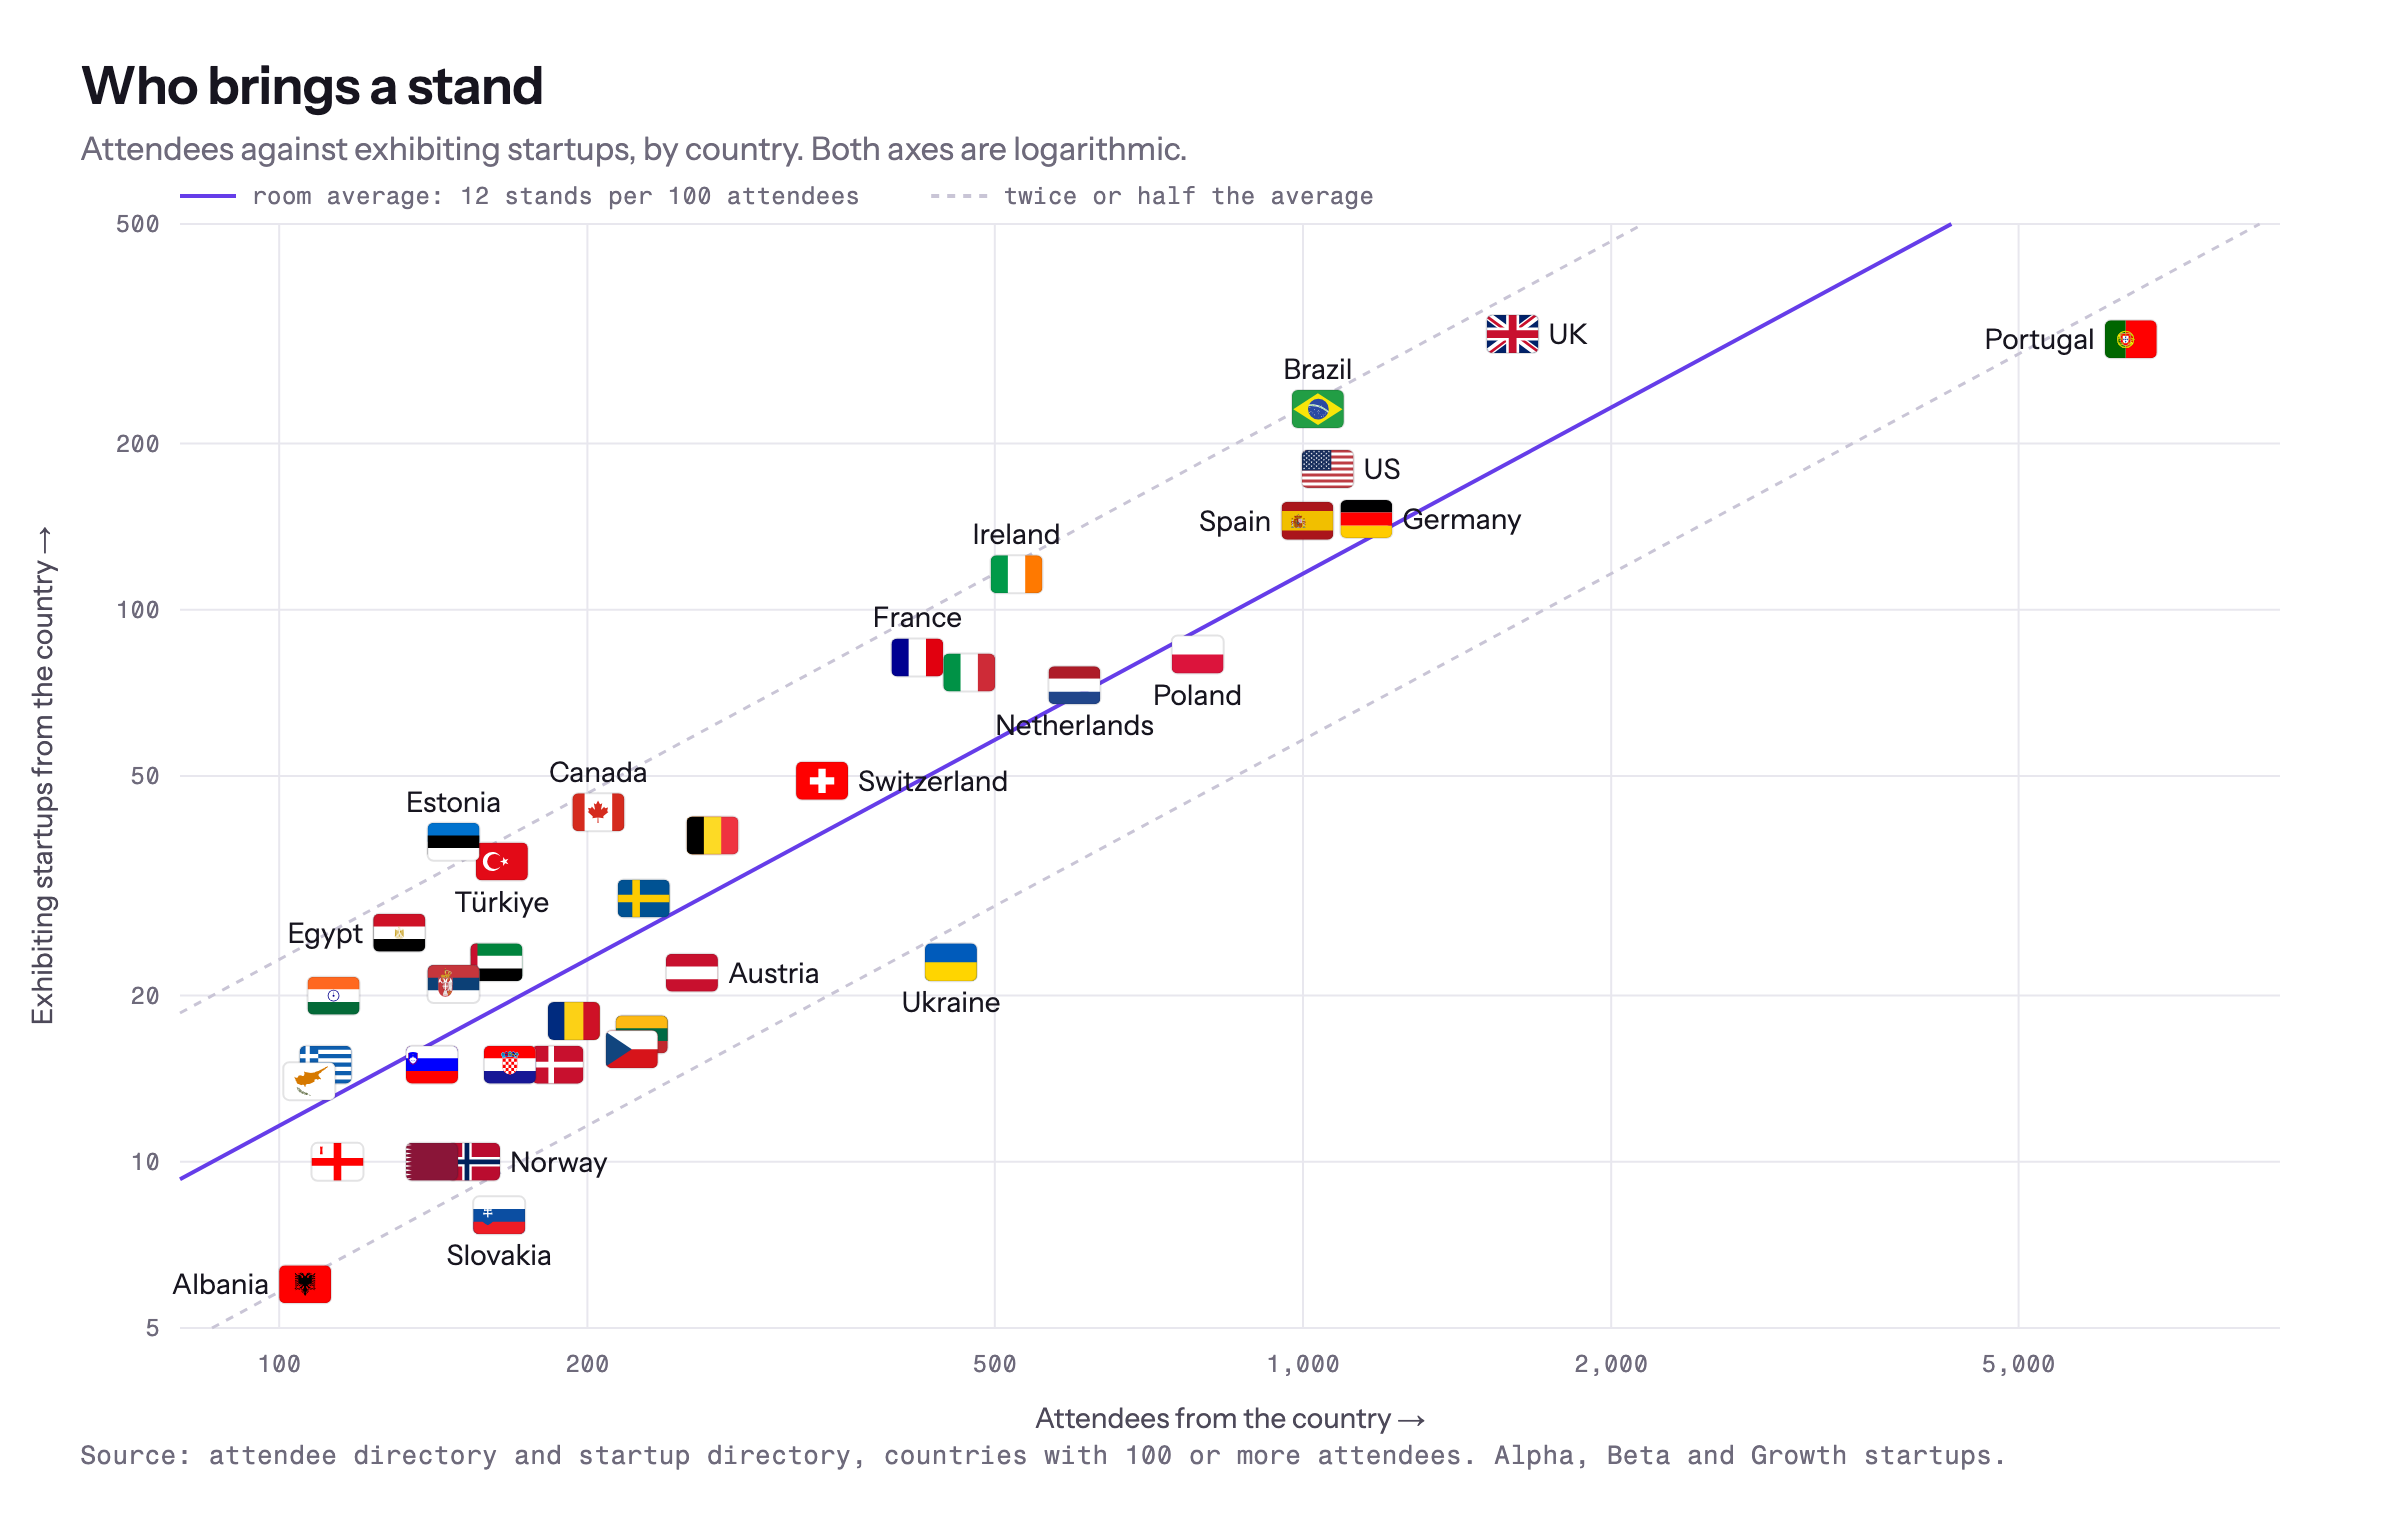
Flip it round and plot each country’s stands against its crowd. There are about 12 exhibiting startups for every 100 attendees. Estonia, Brazil, Ireland and the UK are at double that: they come to sell. Portugal, Slovakia, Ukraine and Norway are at half: they come to look. Brazil sent the fifth-largest delegation and the third-most startups. Brazil is not here to browse.
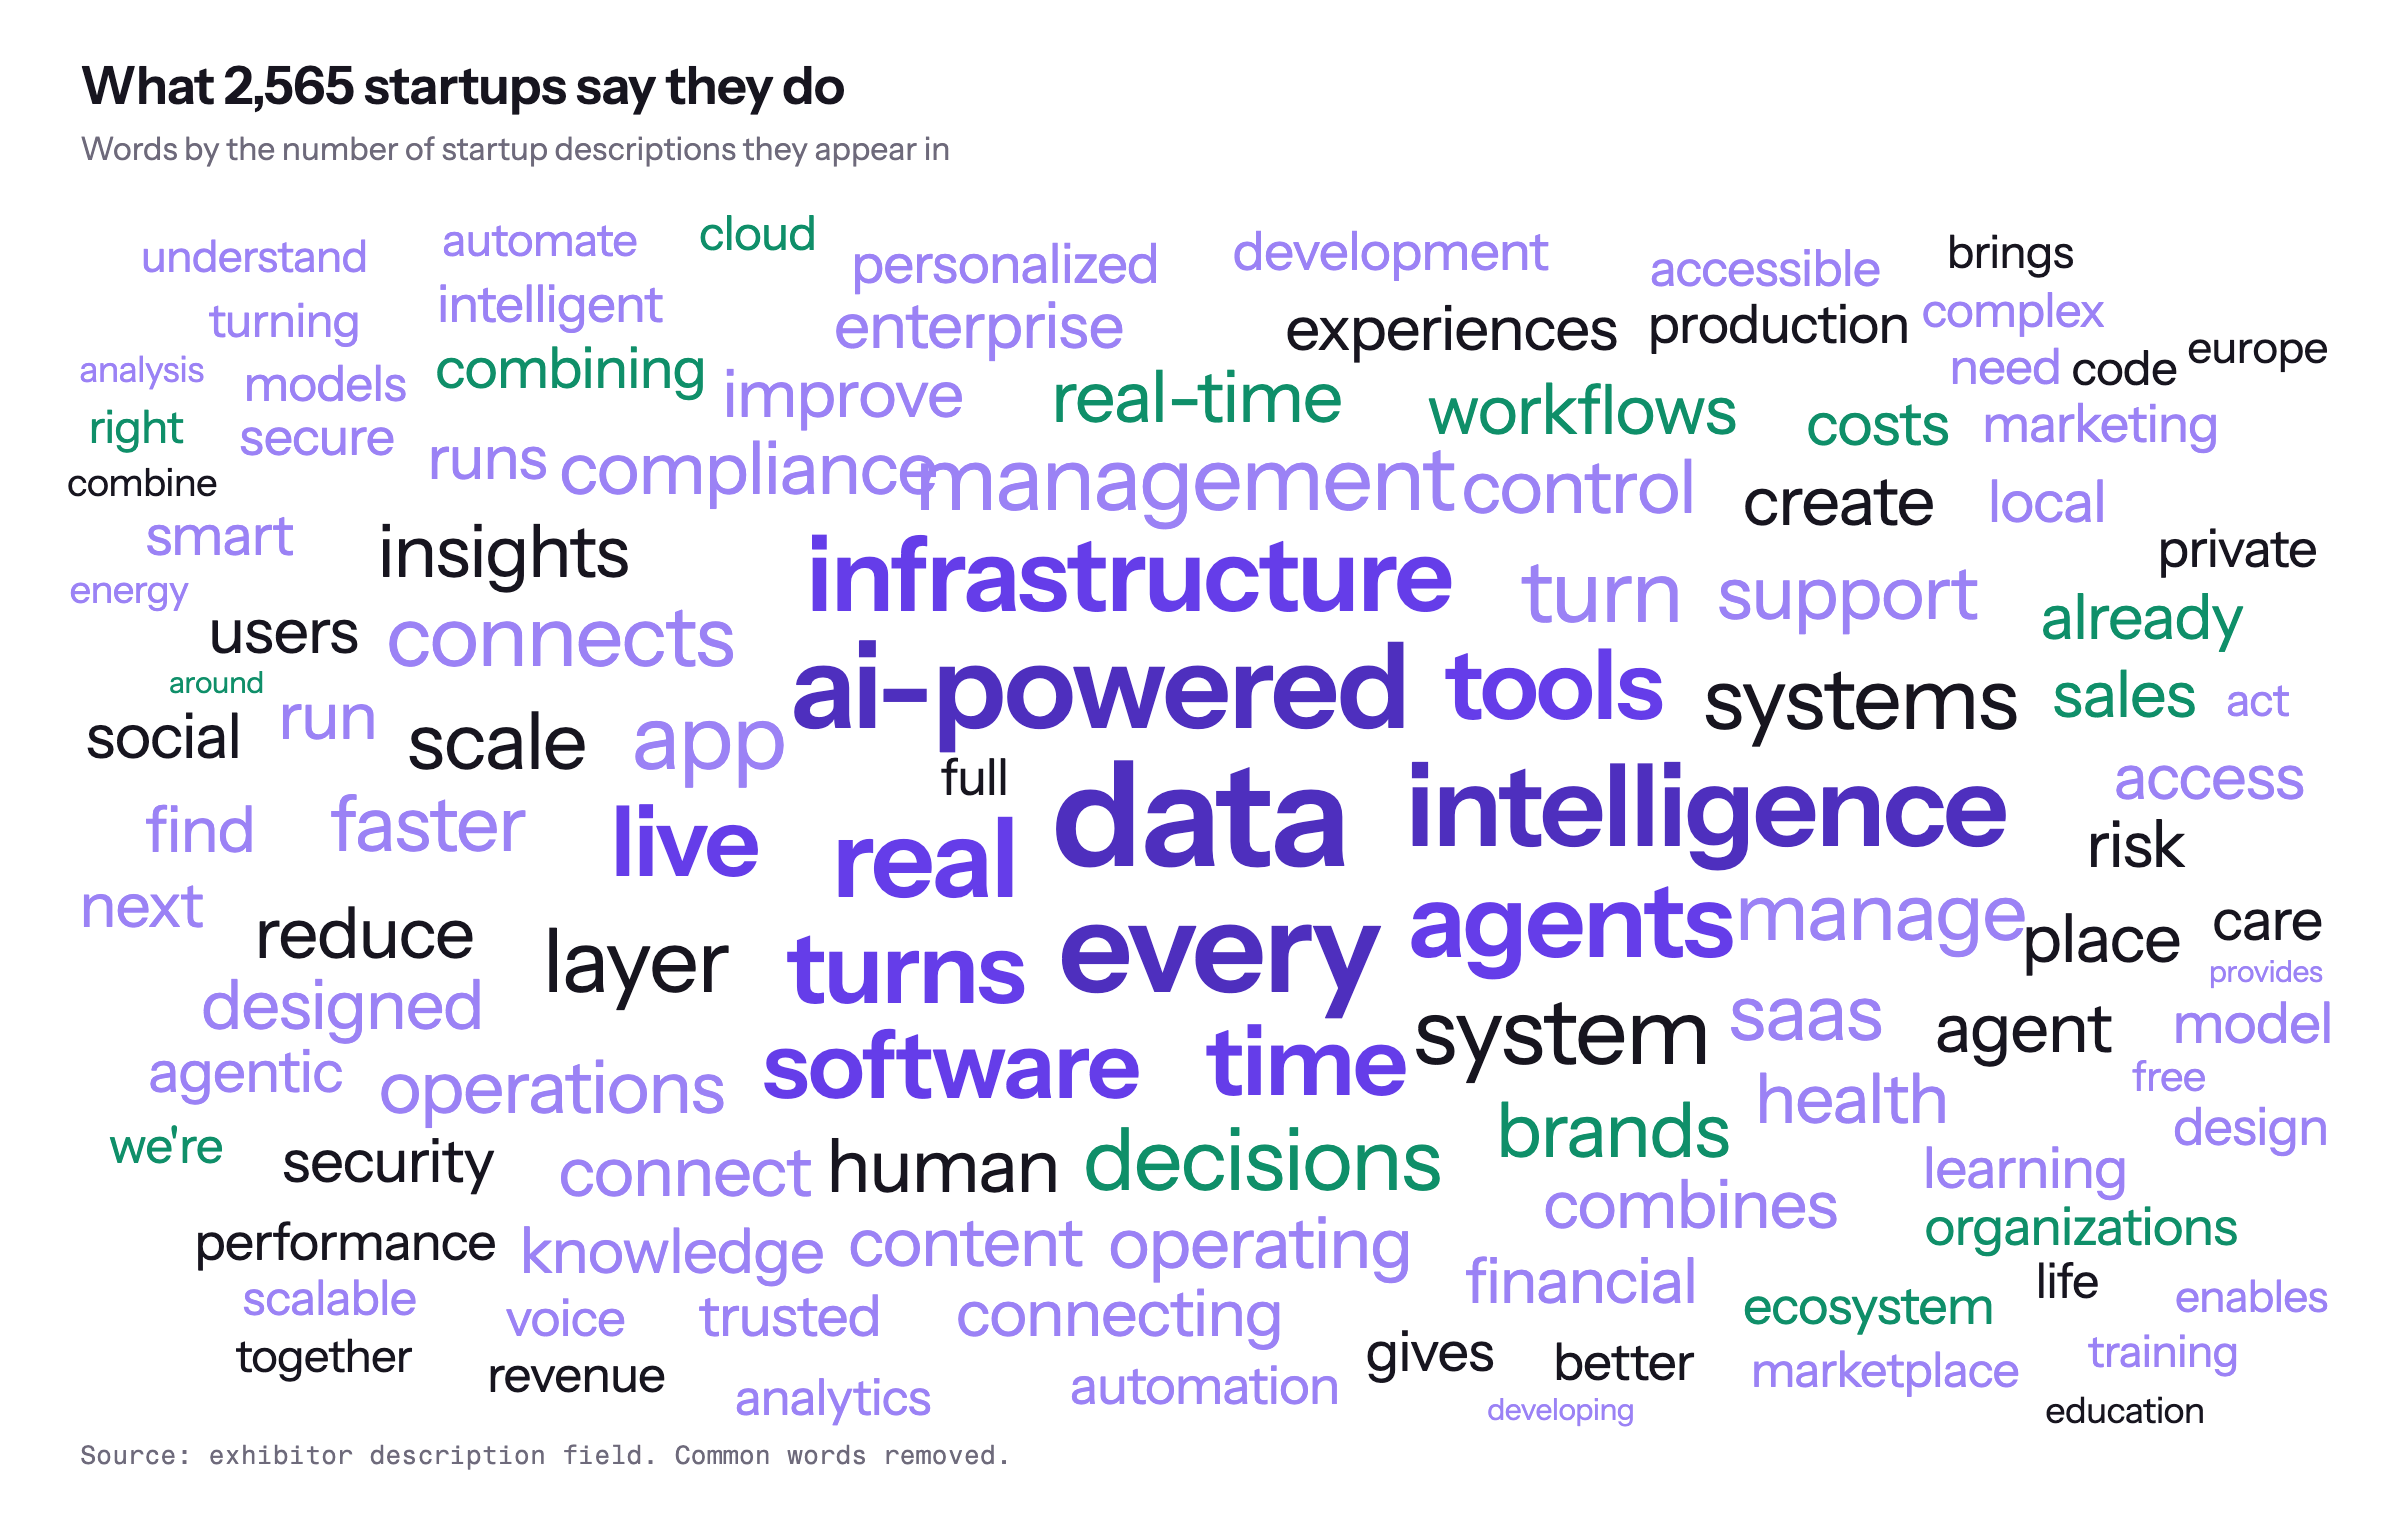
The descriptions read differently from the bios. Attendees talk about themselves; startups talk about data, intelligence, agents, infrastructure and “real time”. The word “every” is in 344 of them, usually followed by “business” or “team”.
And the number we care most about: how many of the 2,604 startups are in our business? Searching every description for scraping, crawling, web data or data extraction gives four hits. Three aren’t: Arbling verifies agentic commerce, HoneyLog tells you which bots are scraping you, San Jose Automation matched on manufacturing scrap. That leaves one startup out of 2,604, MyDatAgent, plus two partners rather than exhibitors: Apify and Infatica, a proxy network. The field is wide open, which is either very good news or a sign we should check our assumptions. Our guide to data extraction tools covers the nine products we’re usually compared with.
Picks and shovels
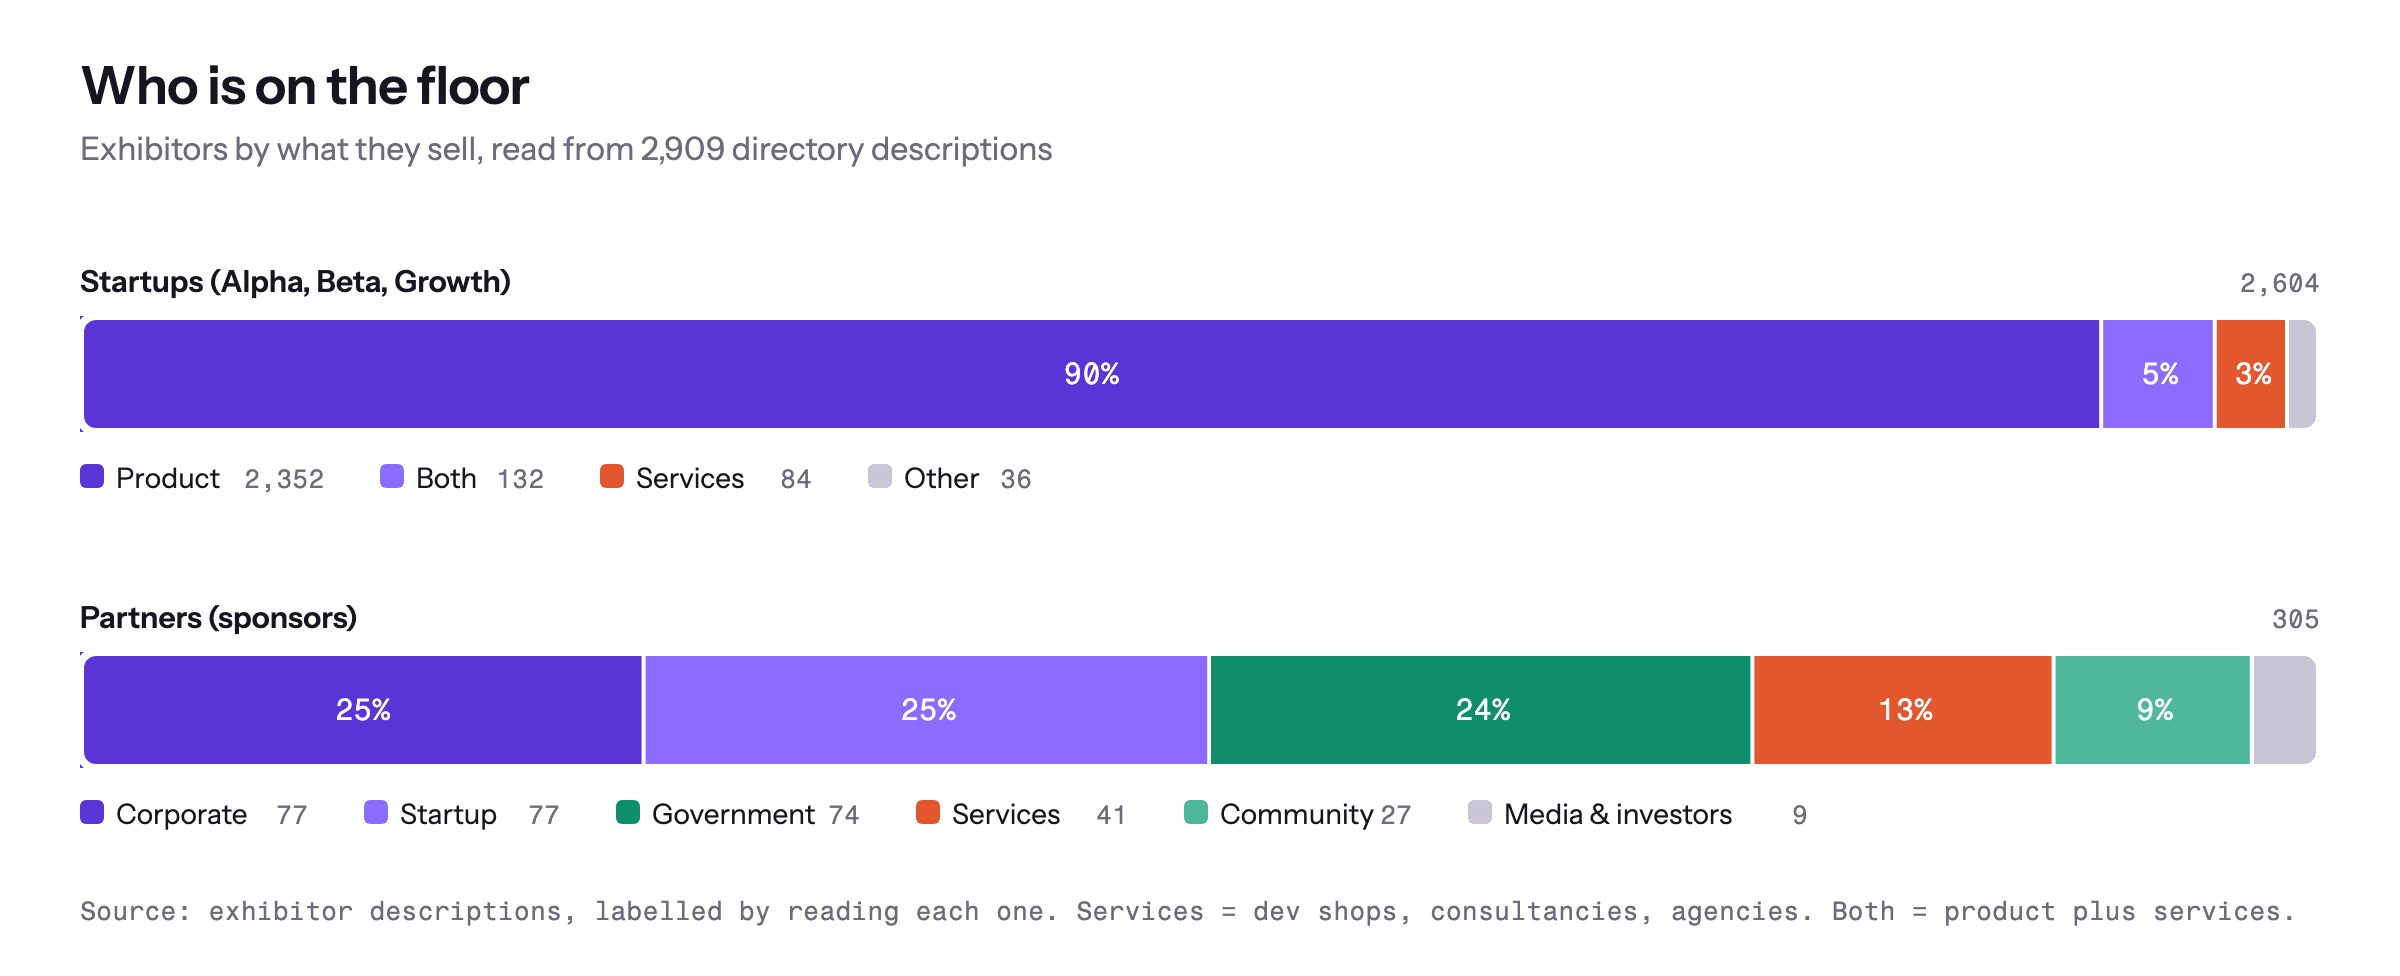
A software development company found us in the app this week, which raised a question: how much of the startup floor is startups, and how much is people selling to startups? Web Summit has no field for this either, so we read all 2,604 descriptions again and sorted each one into product, services (dev shops, consultancies, agencies, outsourcing), both, or other (programmes, networks, funds).
Nine in ten exhibiting startups sell a product. 84 sell services and another 132 sell a product with services wrapped round it. The sponsor floor is a different place: 41 of the 305 partners are services firms, Publicis Sapient, KPMG, Roland Berger, Toptal, Upwork and Konecta among them, and another 74 are governments and trade agencies. If someone selling development finds you in the app, they are the typical partner, not the typical startup.
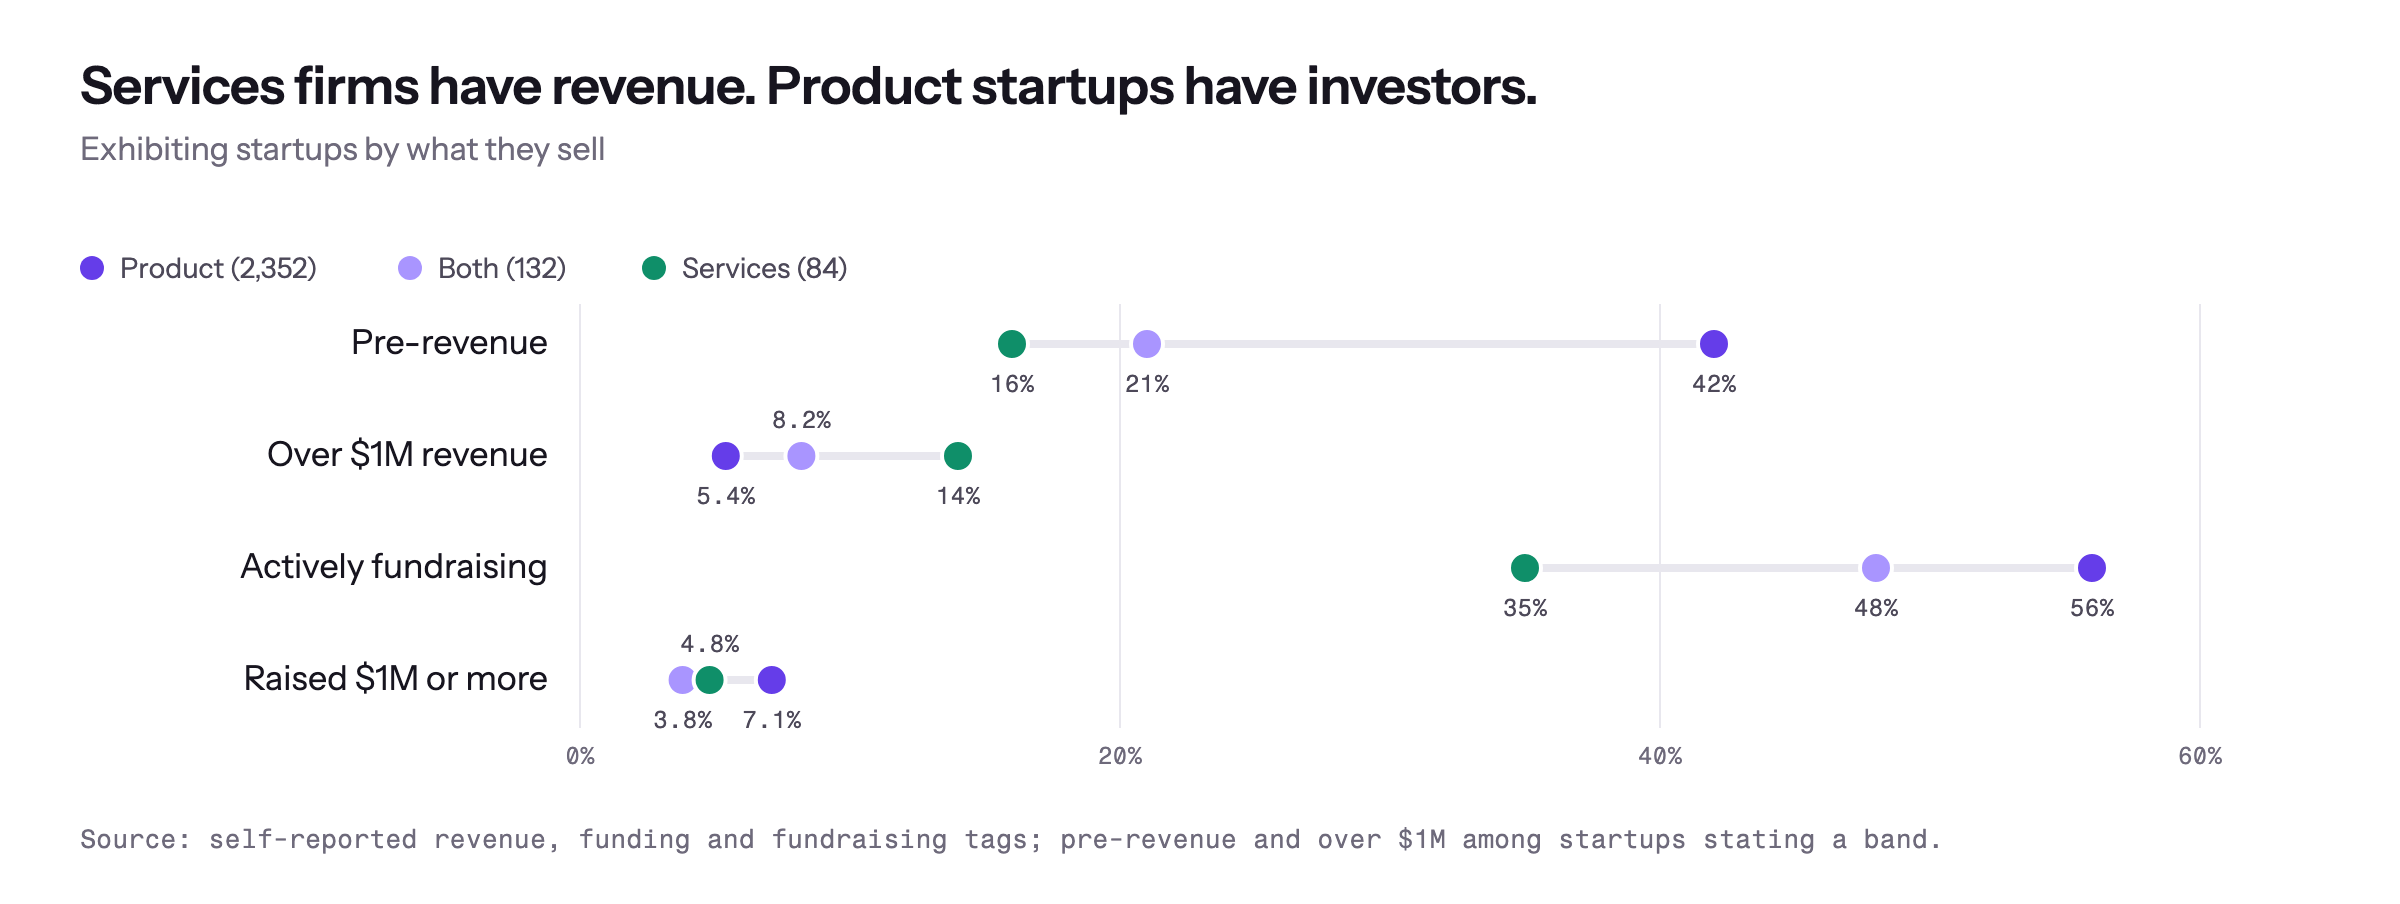
Services firms have revenue. Product startups have investors. Of the services firms stating a band, 16% are pre-revenue, against 42% of product startups, and 14% have passed a million in revenue, against 5%. Only 35% are fundraising. Product startups are twice as likely to have raised a million or more. Both came to Lisbon for money. One is looking for customers, the other for a term sheet.
By country it is flat, 7% to 9% almost everywhere, with one exception: Belgium brought the consultants, nine of its 39 startups.
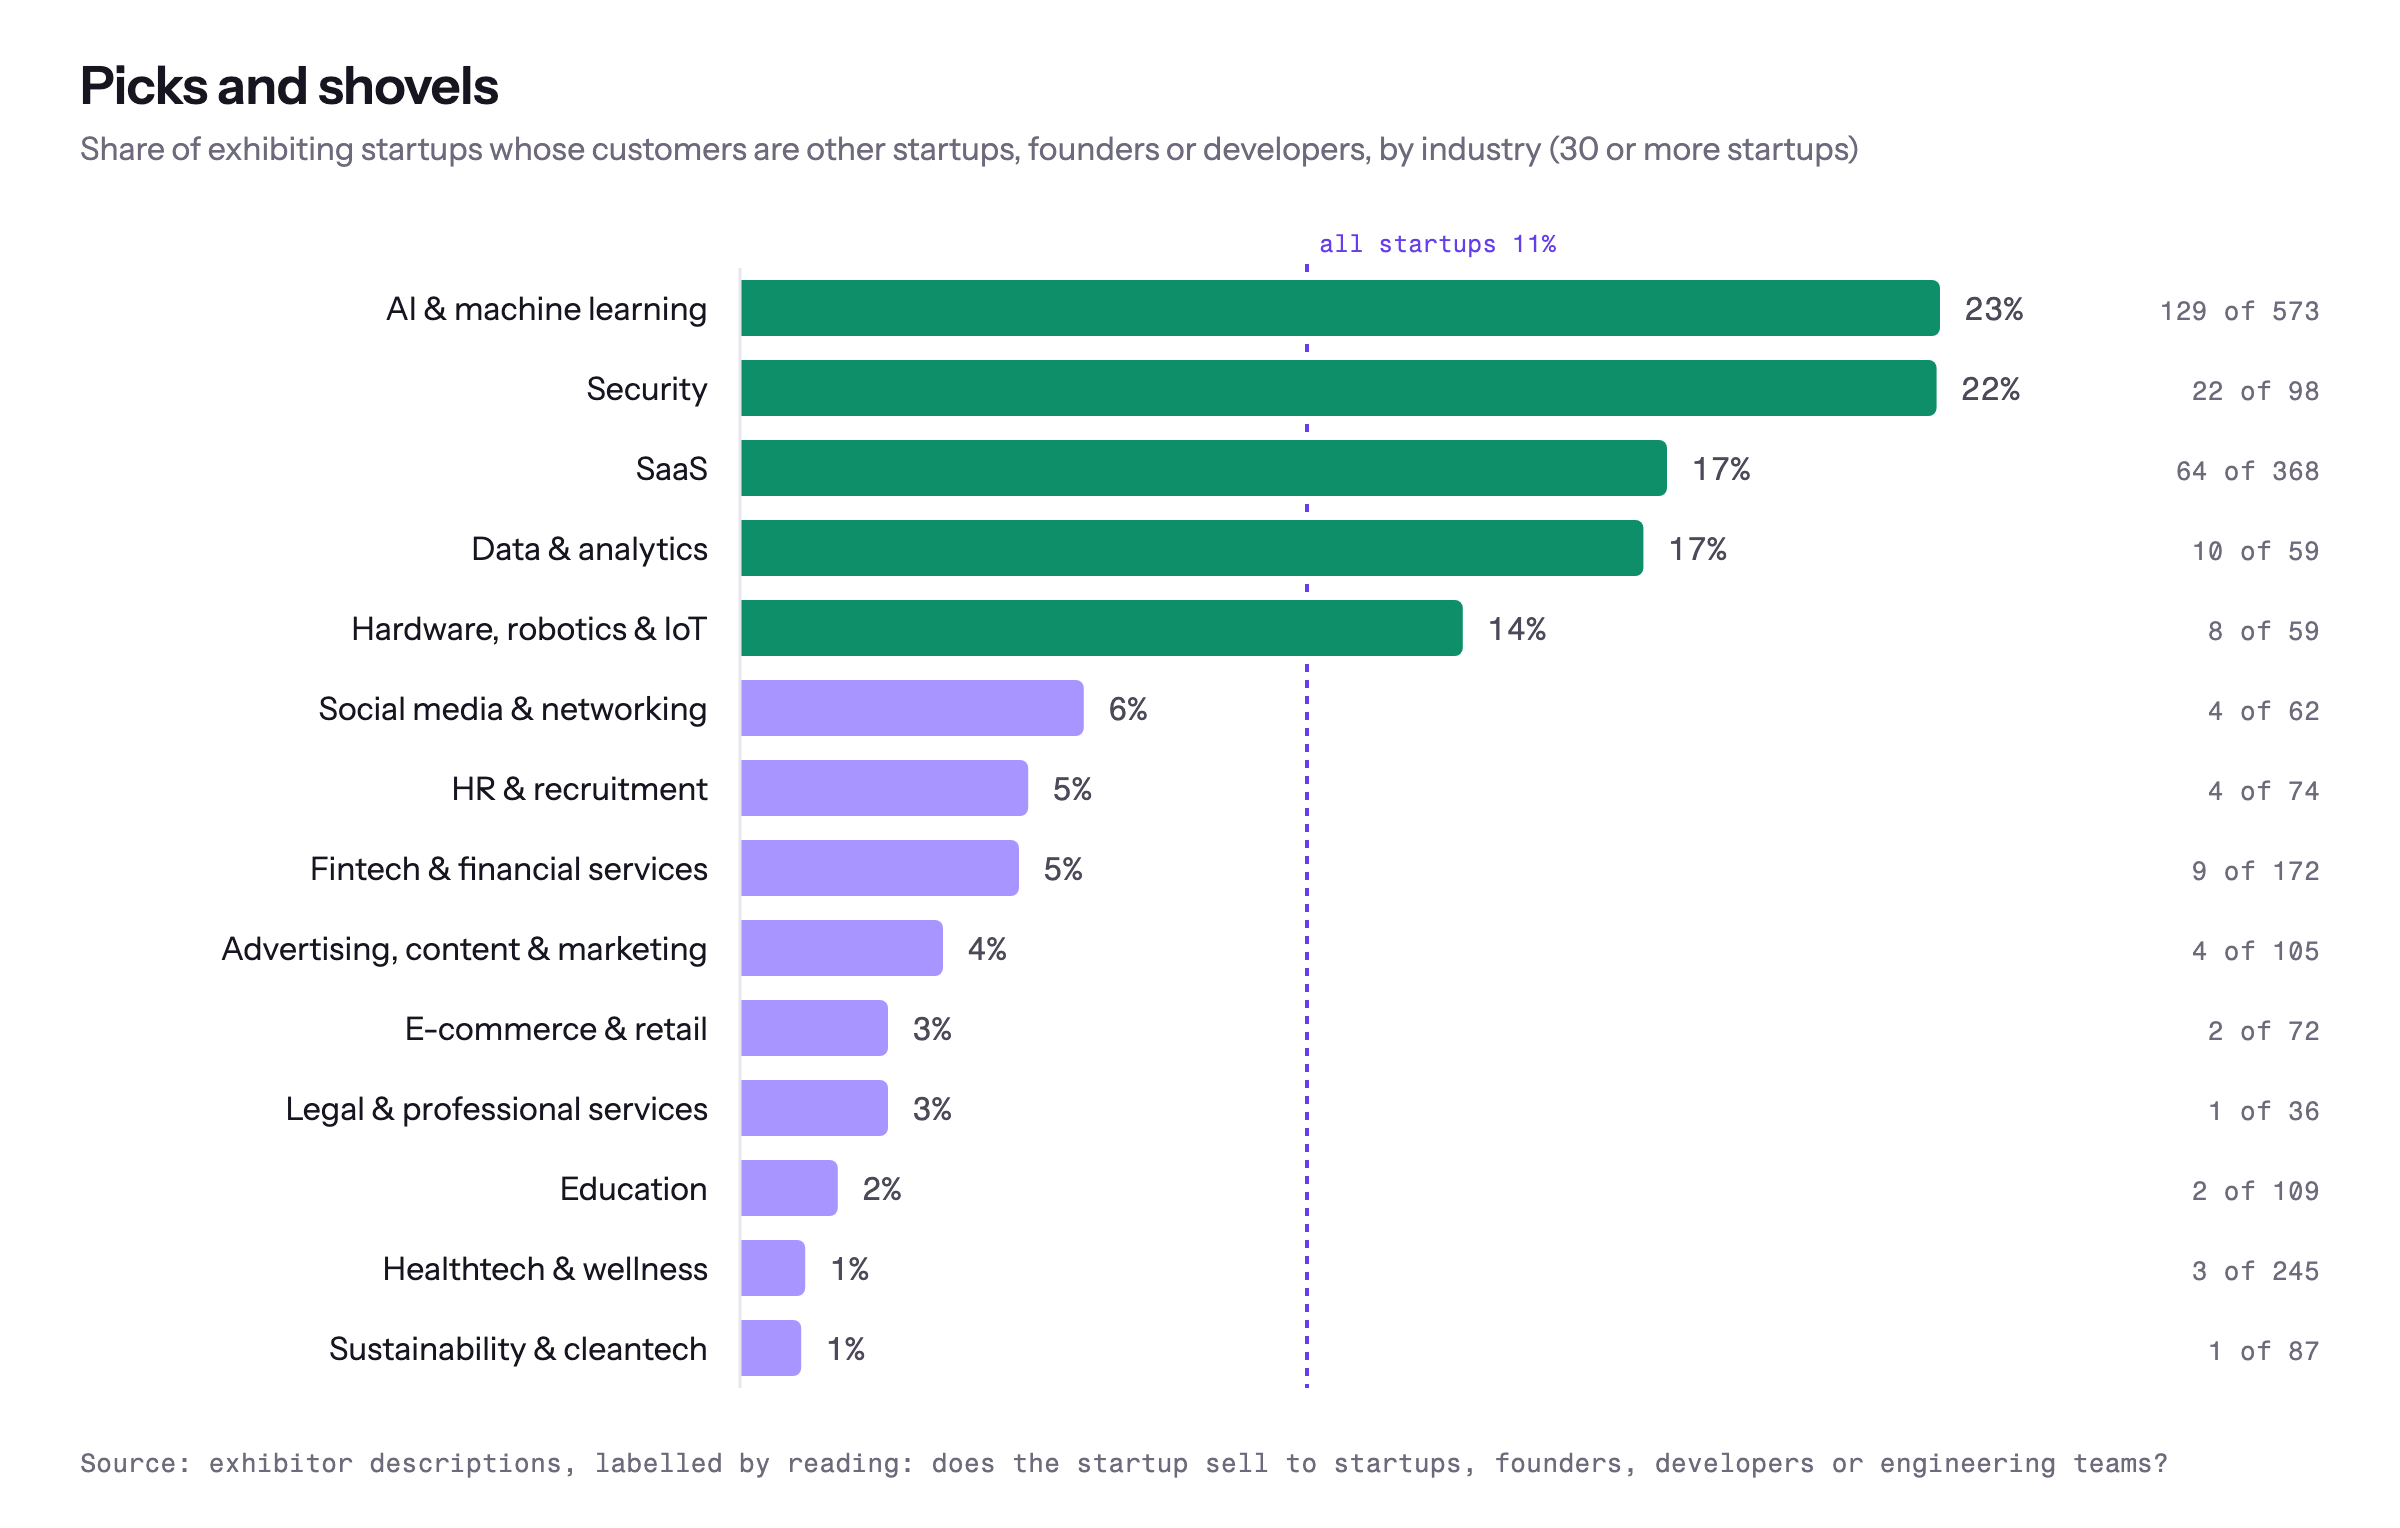
Who sells the shovels. 277 startups, one in nine, sell to other startups, founders or developers: agent frameworks, security scanners for AI-written code, co-founder matching, startup credit platforms. They cluster where you’d expect. A quarter of the AI and security exhibitors sell to builders, a sixth of SaaS and data, and almost nobody in health, education, sustainability or travel. In this gold rush the shovel sellers are no richer than the prospectors: 48% are pre-revenue against 39% of everyone else, though they are a little more likely to have raised a million.
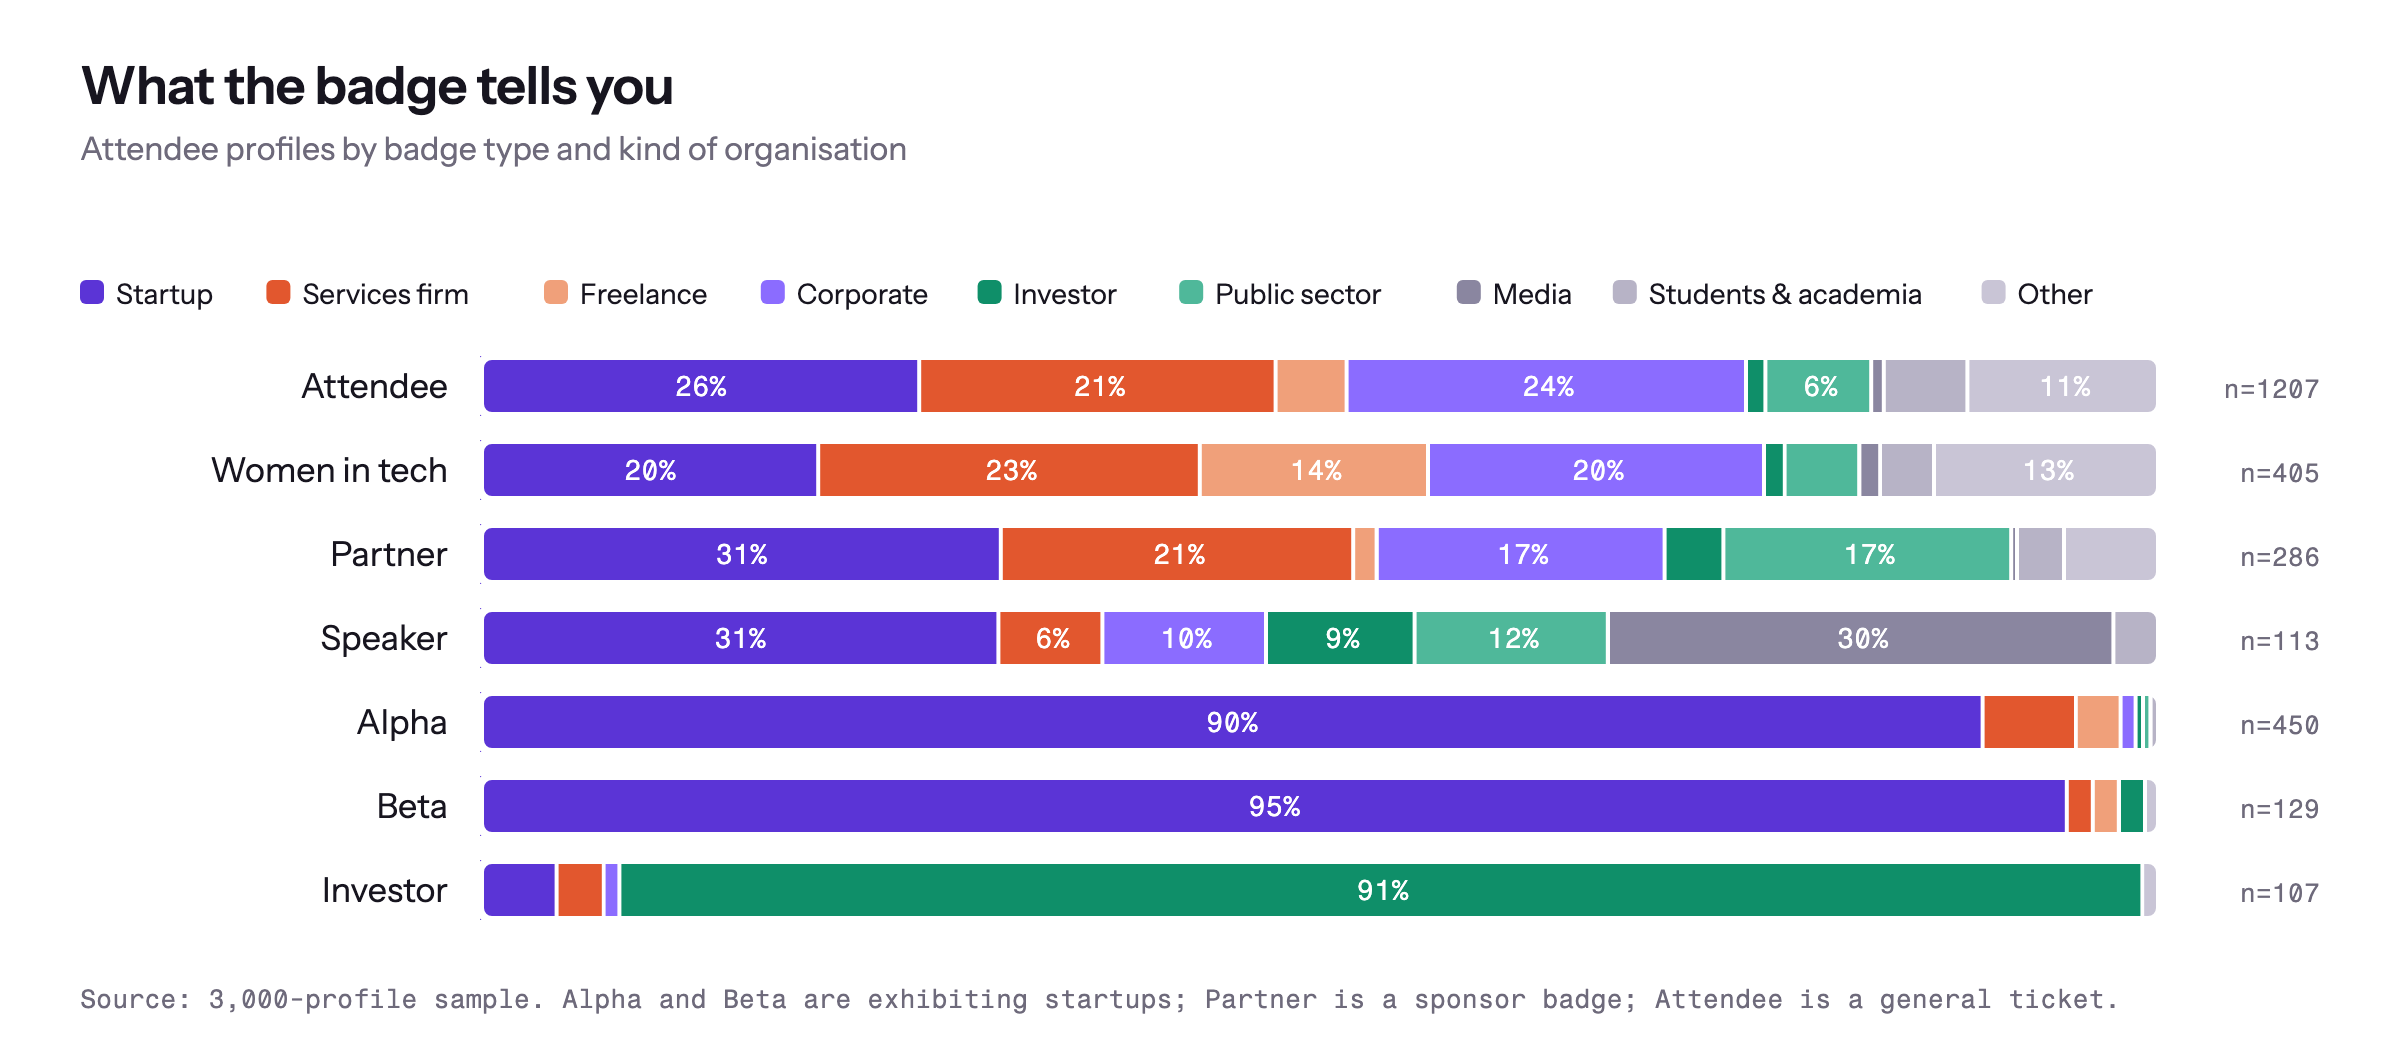
And the people. Stands are one thing; badges are another. We drew 3,000 attendee profiles at random and read each one for the kind of organisation behind it. 37% work at a startup. One in five is selling services: 15% at a firm, 4% freelance, about 4,300 people scaled to the directory, and roughly 2,700 of them selling software, IT or digital work. Another 15% are corporate, 7% investors, 7% public sector, 4% media.
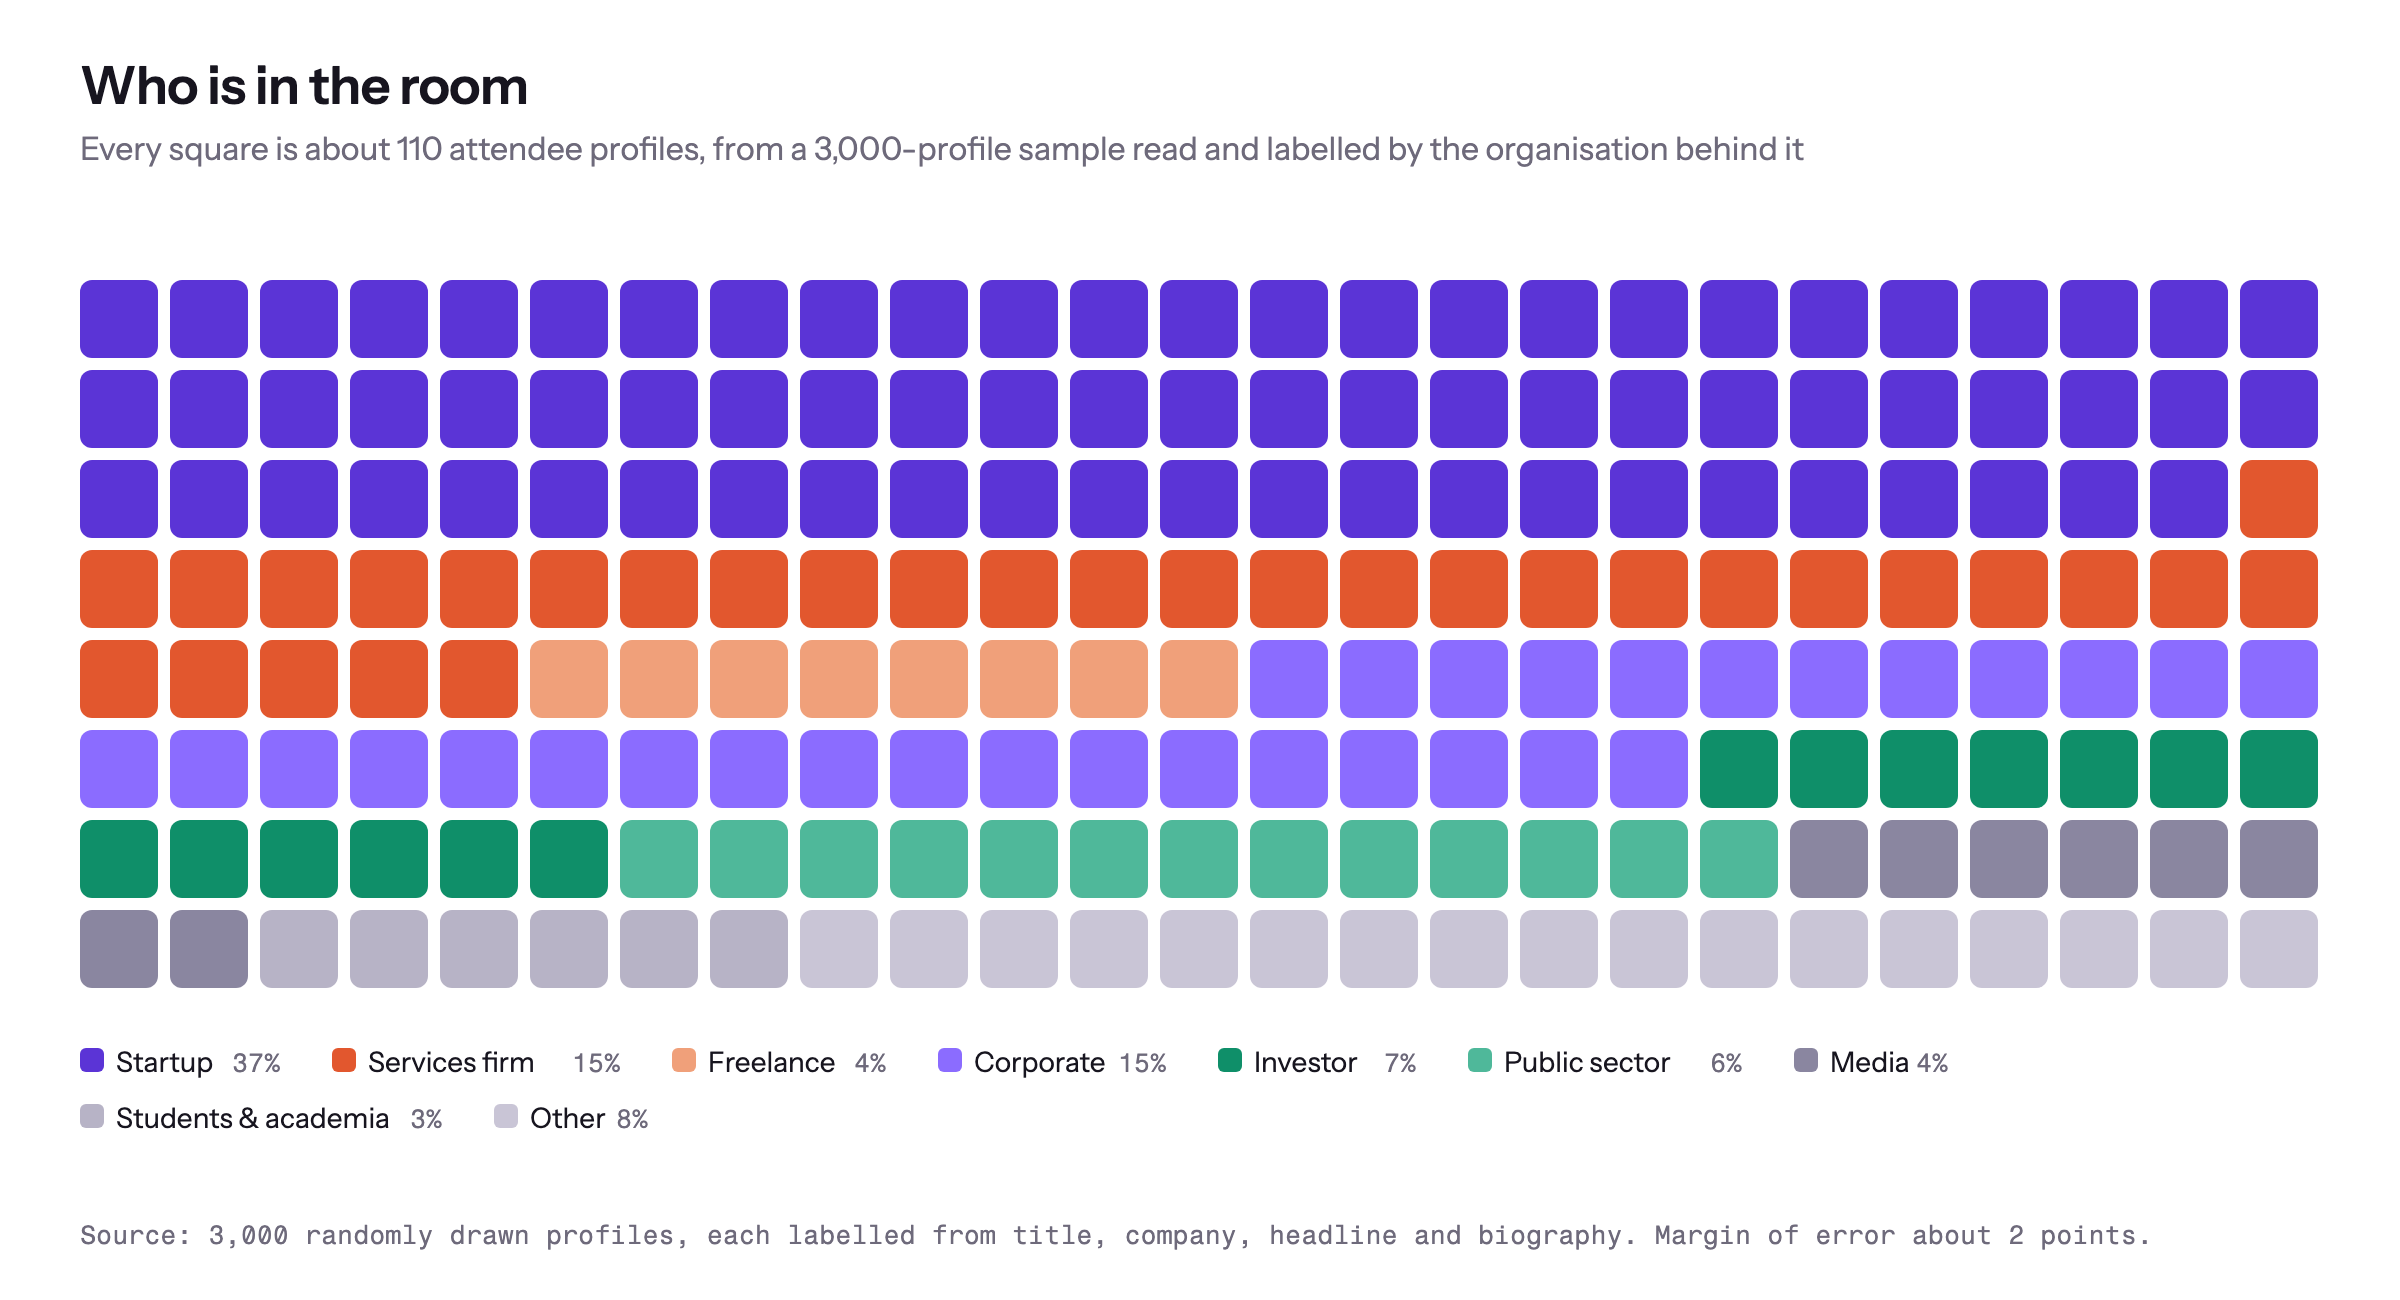
The hosts skew it. Portuguese attendees are 27% startup against 44 to 48% for every visiting country, and make up the gap with services firms, students, media and the public sector. Poland sends the most services people, 21%, the Netherlands the most freelancers, 10%, Brazil the most public sector, 15%. The badge tells you less than you’d think: Alpha, Beta and Investor badges are what they say, but a general ticket is 26% startup, 21% services and 24% corporate, and a Partner badge is as likely to be a services firm as a corporate. That is how a Kosovan dev shop ends up emailing us with a partner badge and no stand in the directory.
The programme
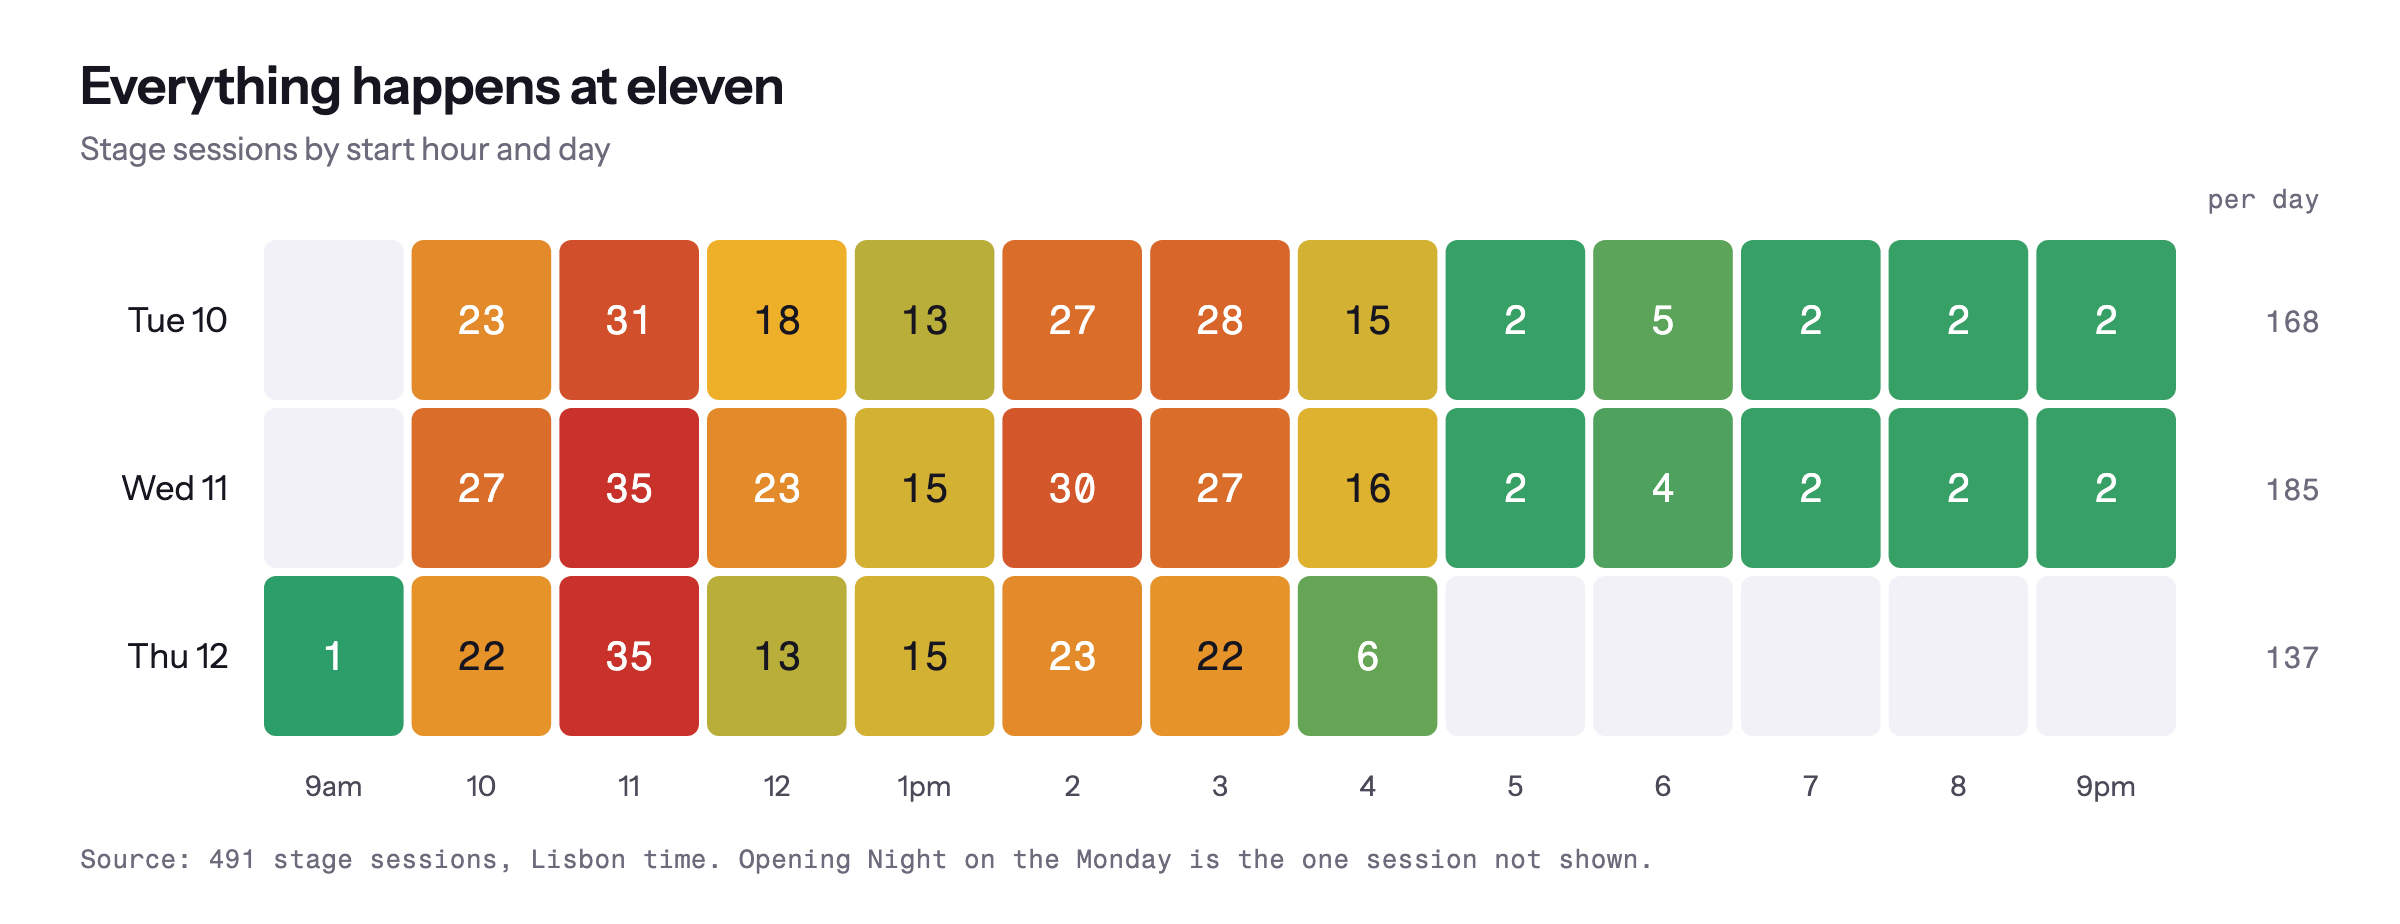
1,153 scheduled entries as of 8 November: 243 meetups, 113 events at partner stands, 86 Night Summit listings and 699 sessions on a stage, across 22 stages, masterclass rooms and lounges over three days. The October programme had 491 of those. Web Summit publishes late.
If you’re planning your days, know that everything happens at eleven, and at ten: 125 sessions start in the 11am hour and 124 in the 10am hour, with two and three o’clock close behind. Wednesday is the busiest day, with 249 sessions. The stages empty after four, and Night Summit takes over.
- The median stage session is 20 minutes. Keynotes are 17 and a half at the median, firesides 20, panels 25, masterclasses 45 and the pitch rounds an hour.
- 72 session titles are questions. “Do we need a UN AI treaty?” “Are job interviews real anymore?” “What makes a startup fundable in 2026?” We’ll report back.
- 1,064 people are speaking, not counting the 646 founders in a pitch round or showcase. The moderators are journalists: the Financial Times has seven speakers on the programme, the BBC six, CNN and Reuters five each. Only IBM and Intel, both partners, send more.
One more cross we hadn’t seen anyone run: who is on a stage, and who has a stand? We matched every programme speaker to the exhibitor list, by company name and by each stand’s listed team, setting aside the pitch rounds and the Startup Showcase, which put 646 founders on a stage by design. 33 of 2,604 exhibiting startups have anyone speaking. Nine of the 2,036 Alpha-tier startups do. Partners, the sponsors, are at three in ten.
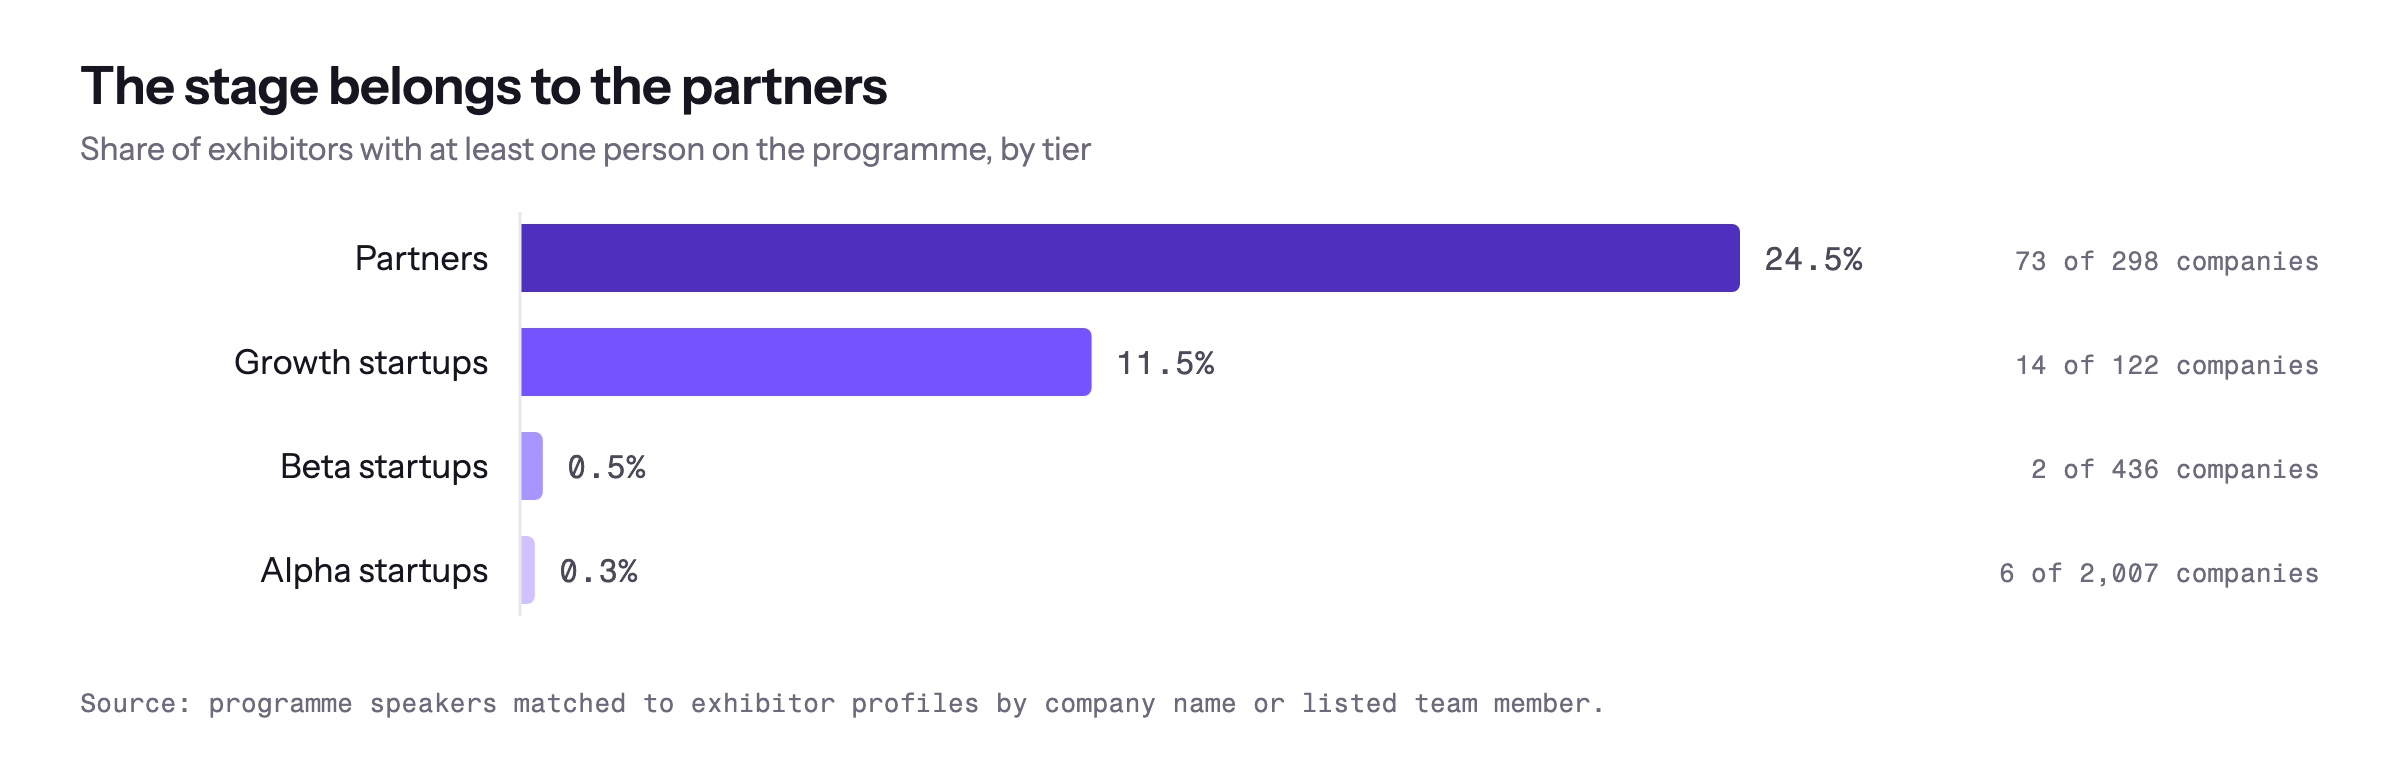
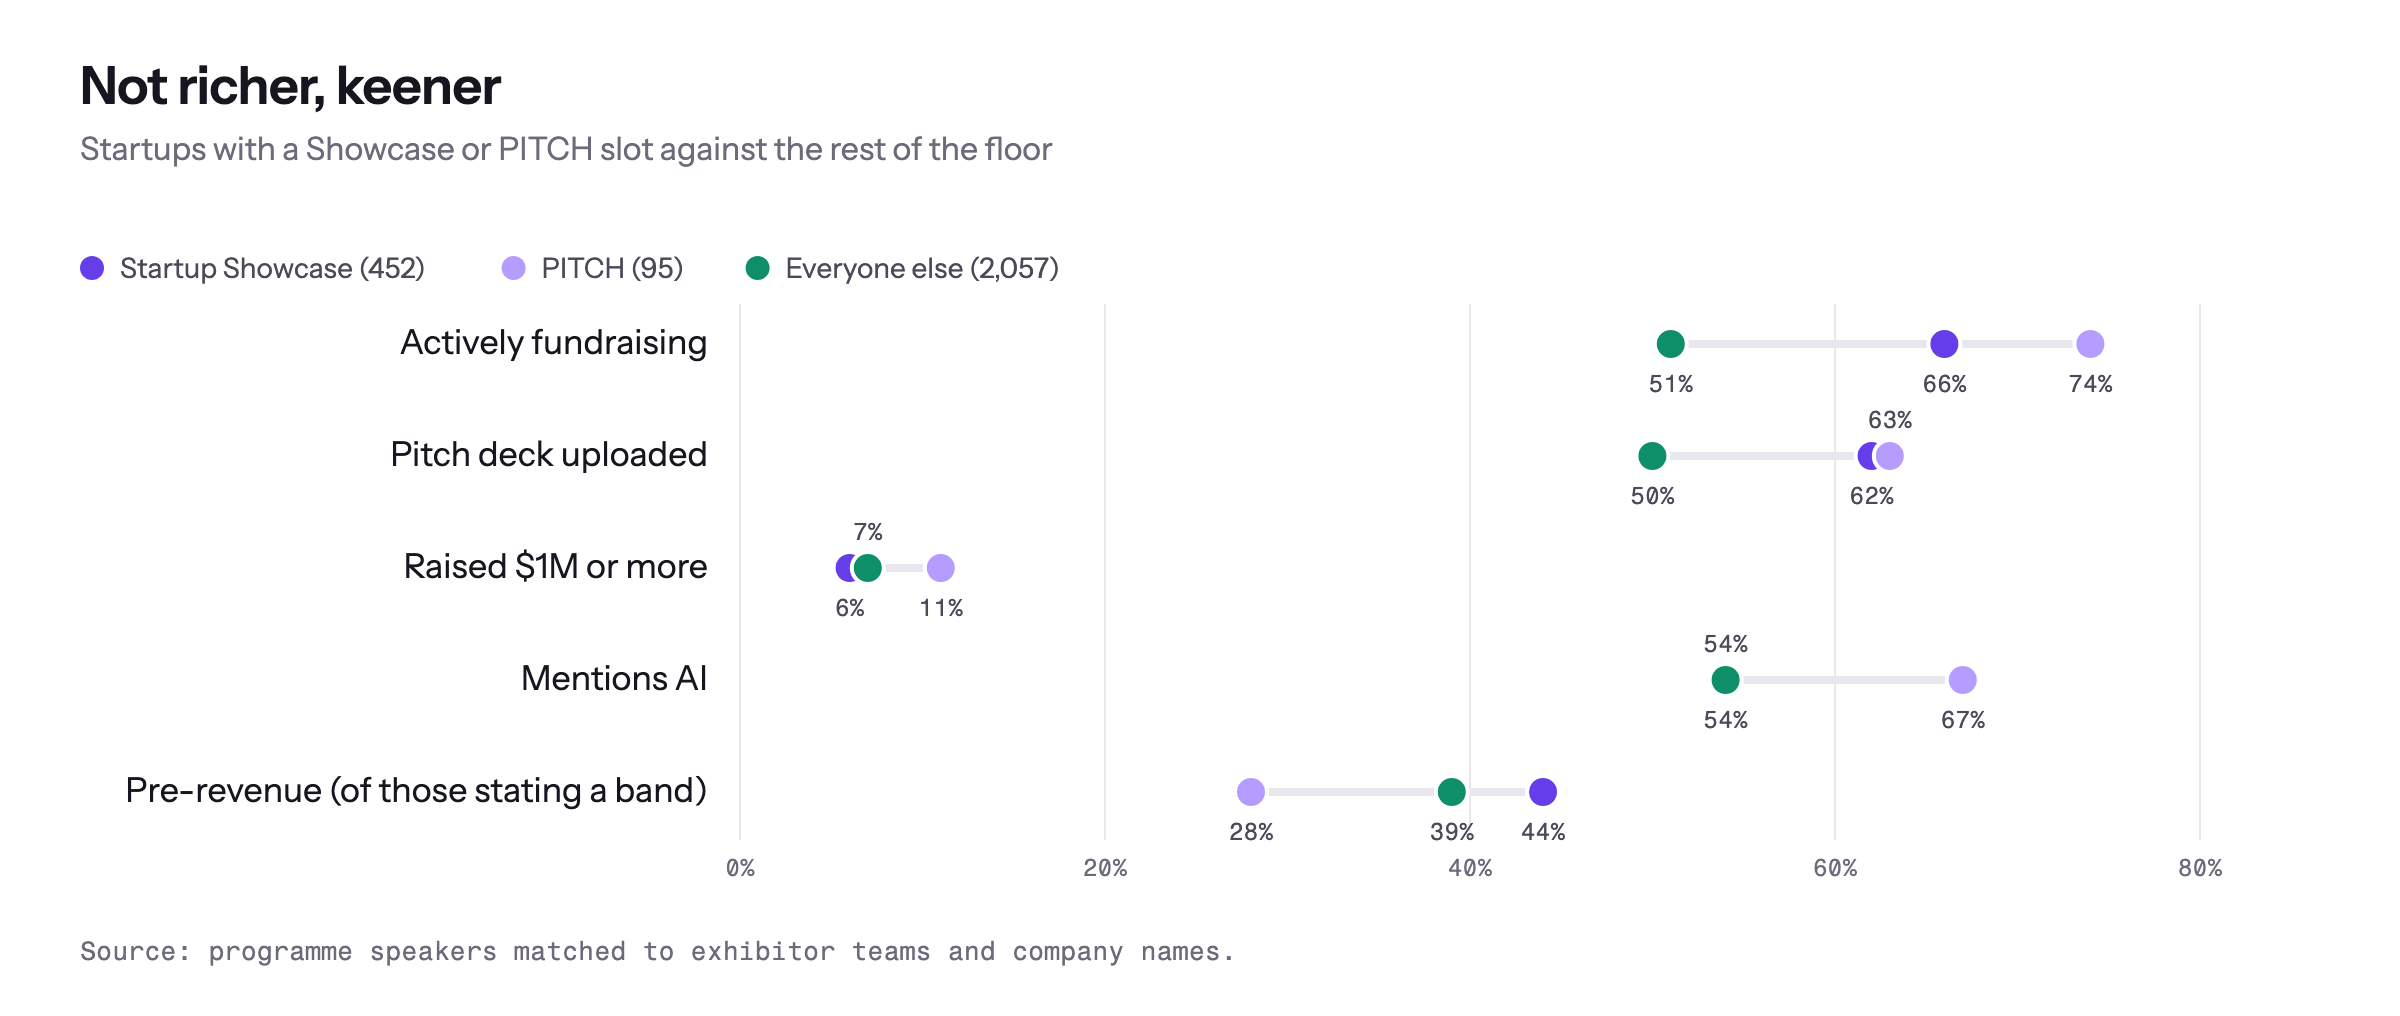
The stage and the floor are two different conferences that share a venue. The speakers who aren’t partners are journalists, investors, academics and politicians, not founders. The pitch rounds and showcases are a third conference: 452 startups get a Showcase slot, two and a half minutes each, and 95 more are in PITCH. They are not the richer startups. They are the keener ones. They report the same revenue as the rest of the floor or less, but 66% and 74% of them are fundraising against 51% of everyone else, they bring bigger stands, and they upload decks. Swiss startups are the keenest, 37% of them have a slot; Brazil, which brings the most stands per attendee, mostly skips it at 11%.
The AI question
Which isn’t a question any more. We counted mentions of AI, machine learning and LLMs in all three tables, and crypto, web3 and blockchain alongside for comparison.
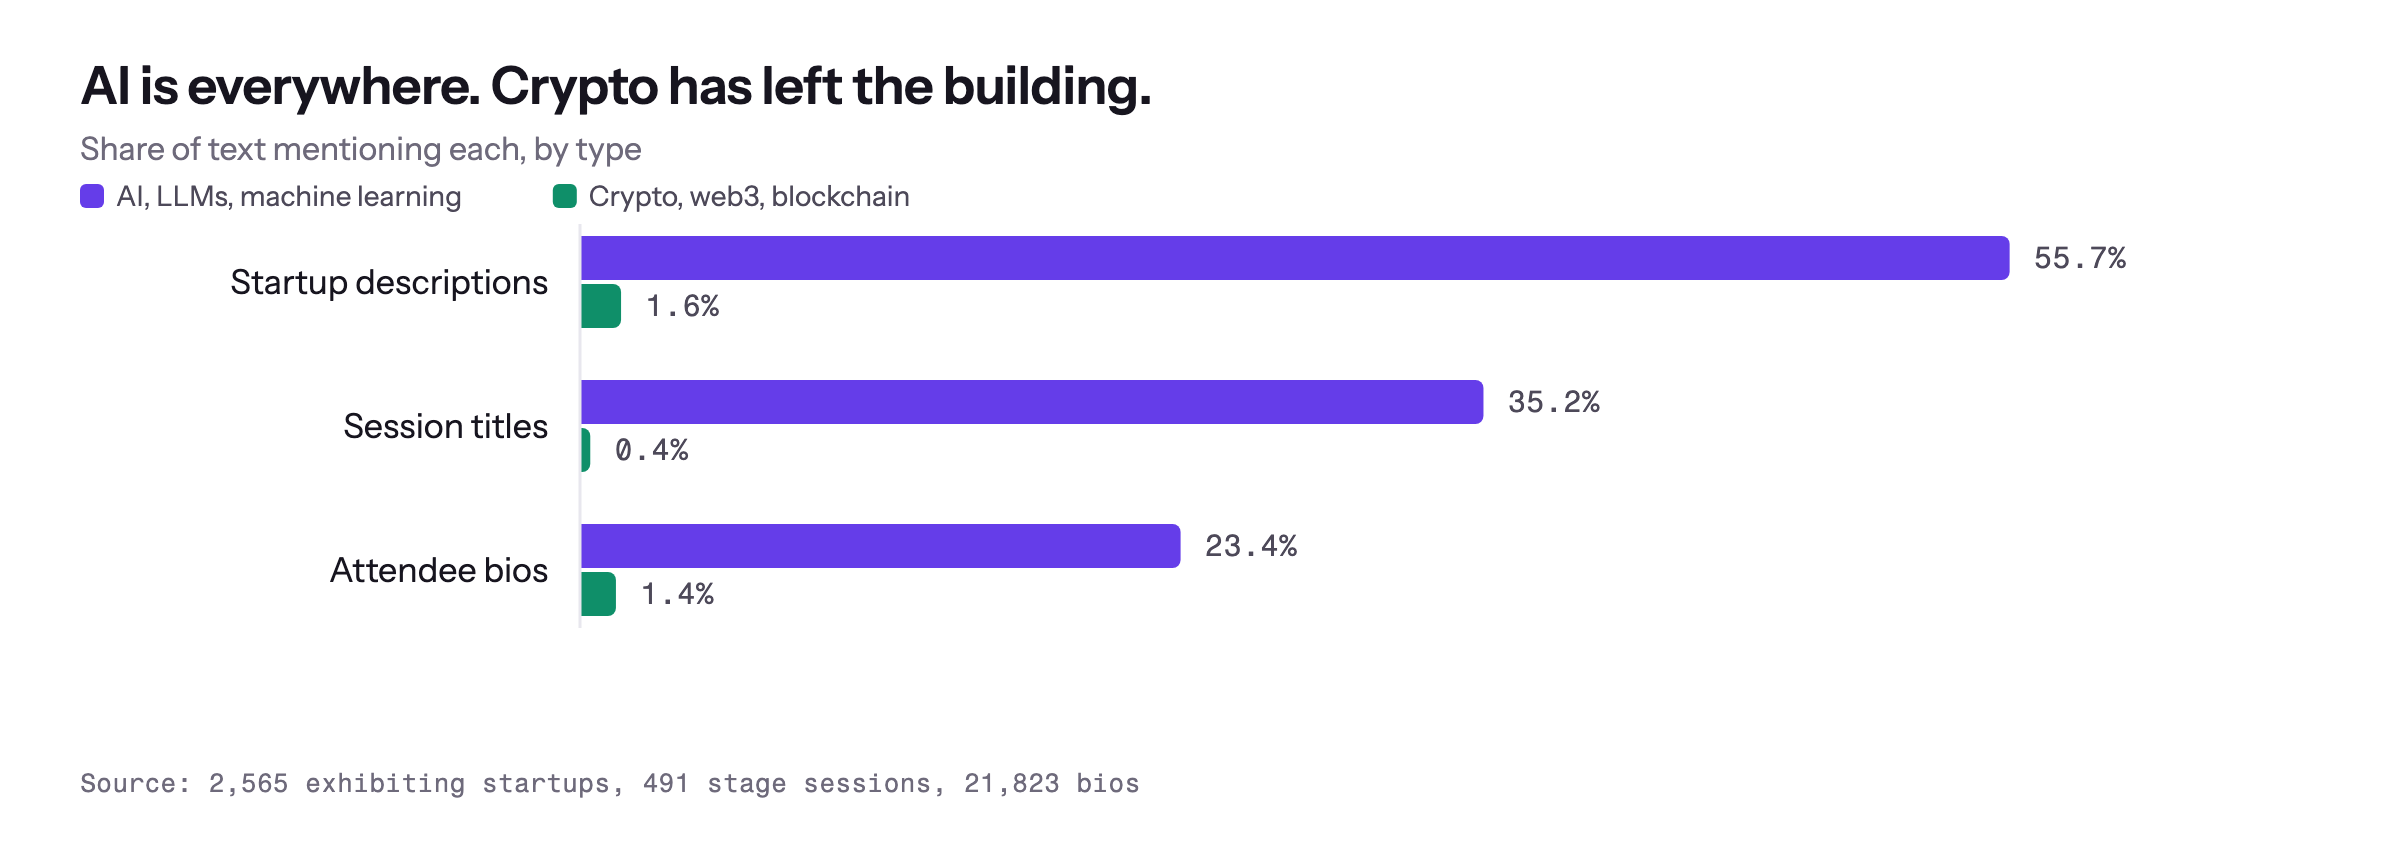
56% of startup descriptions mention AI. In the “AI & machine learning” category it’s 85%; even in healthtech it’s half. Crypto, web3 or blockchain: 41 startups, 1.6%, once we had removed the matches about LLM tokens and cryptography. At the 2022 edition those two numbers were probably the other way round.
31% of stage sessions have AI or agents in the title, 218 of 699. Crypto gets one, and it’s about AI agents trading it. The AI Summit is less than half AI: 43% of its titles mention it, behind the masterclasses at 55% and the Corporate Innovation Summit at 47%. MoneyConf is at 19%; the New Media Summit’s fifteen sessions have none.
23% of attendee bios mention AI, and 193 people describe themselves or their work as “agentic”. By country it splits: the US, UK and Spain at about 30% of bios, Portugal and Brazil at about 16%. The hosts are more relaxed about it than the visitors.
It splits by job too. CTOs mention AI in 37% of their bios, founders and CEOs in a third. Engineers, the people who build it, are at 22%. Investors are at 18%, marketing at 16% and students at 13%. The closer you are to the money or the code, the less you say about it.
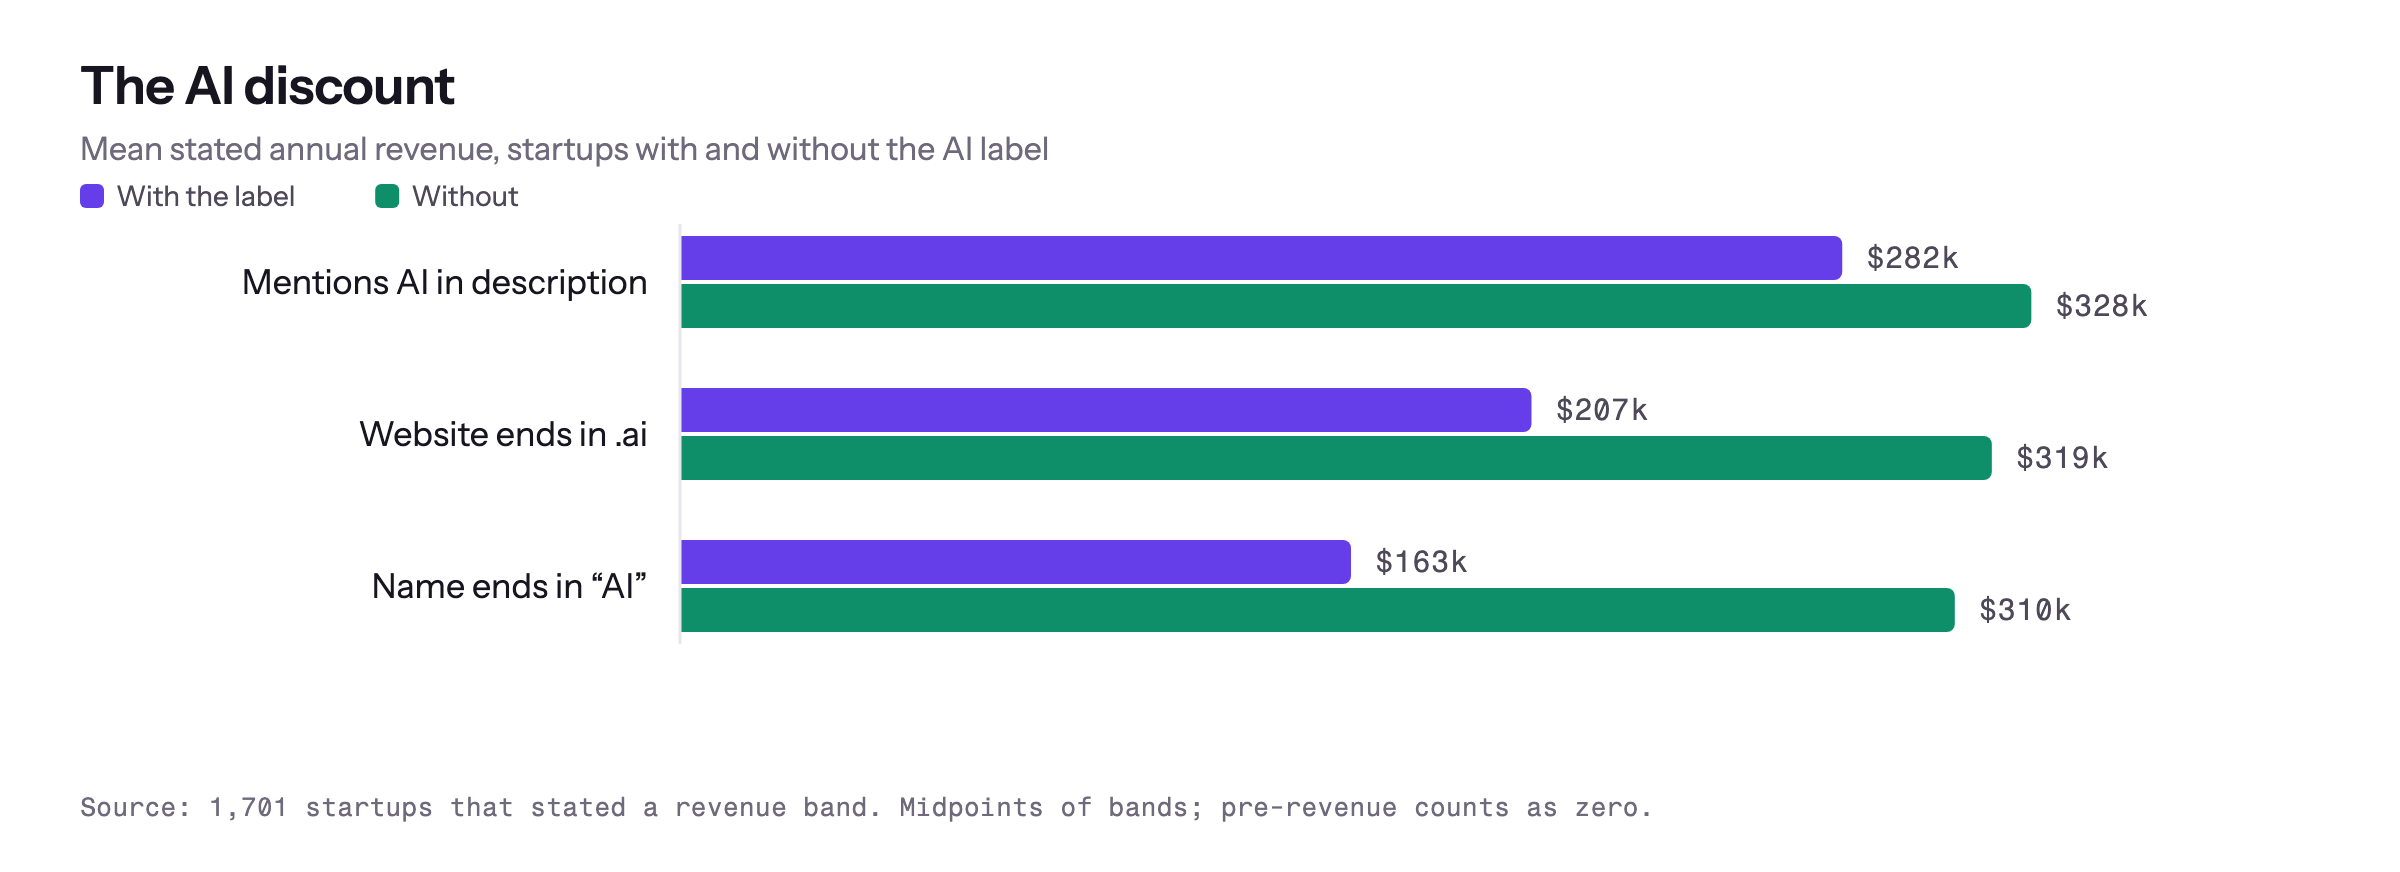
Back to the startups, who wear the label three ways. .ai is the second most popular domain ending, with 406 startups, ahead of .io (160) and .app (127). Only .com beats it, and our guess is that .io held second place until recently; domain endings are a lagging indicator of what founders think investors want. 177 startup names end in “AI”, from Rapid Deploy AI to SleekSite.AI.
The AI discount. Startups that mention AI in their description report lower average revenue than those that don’t; a .ai domain lower still; a name ending in “AI” about half. The label correlates with being early, not with being rich. The same startups are a little more likely to be fundraising, 57% against 51%.
Follow the money
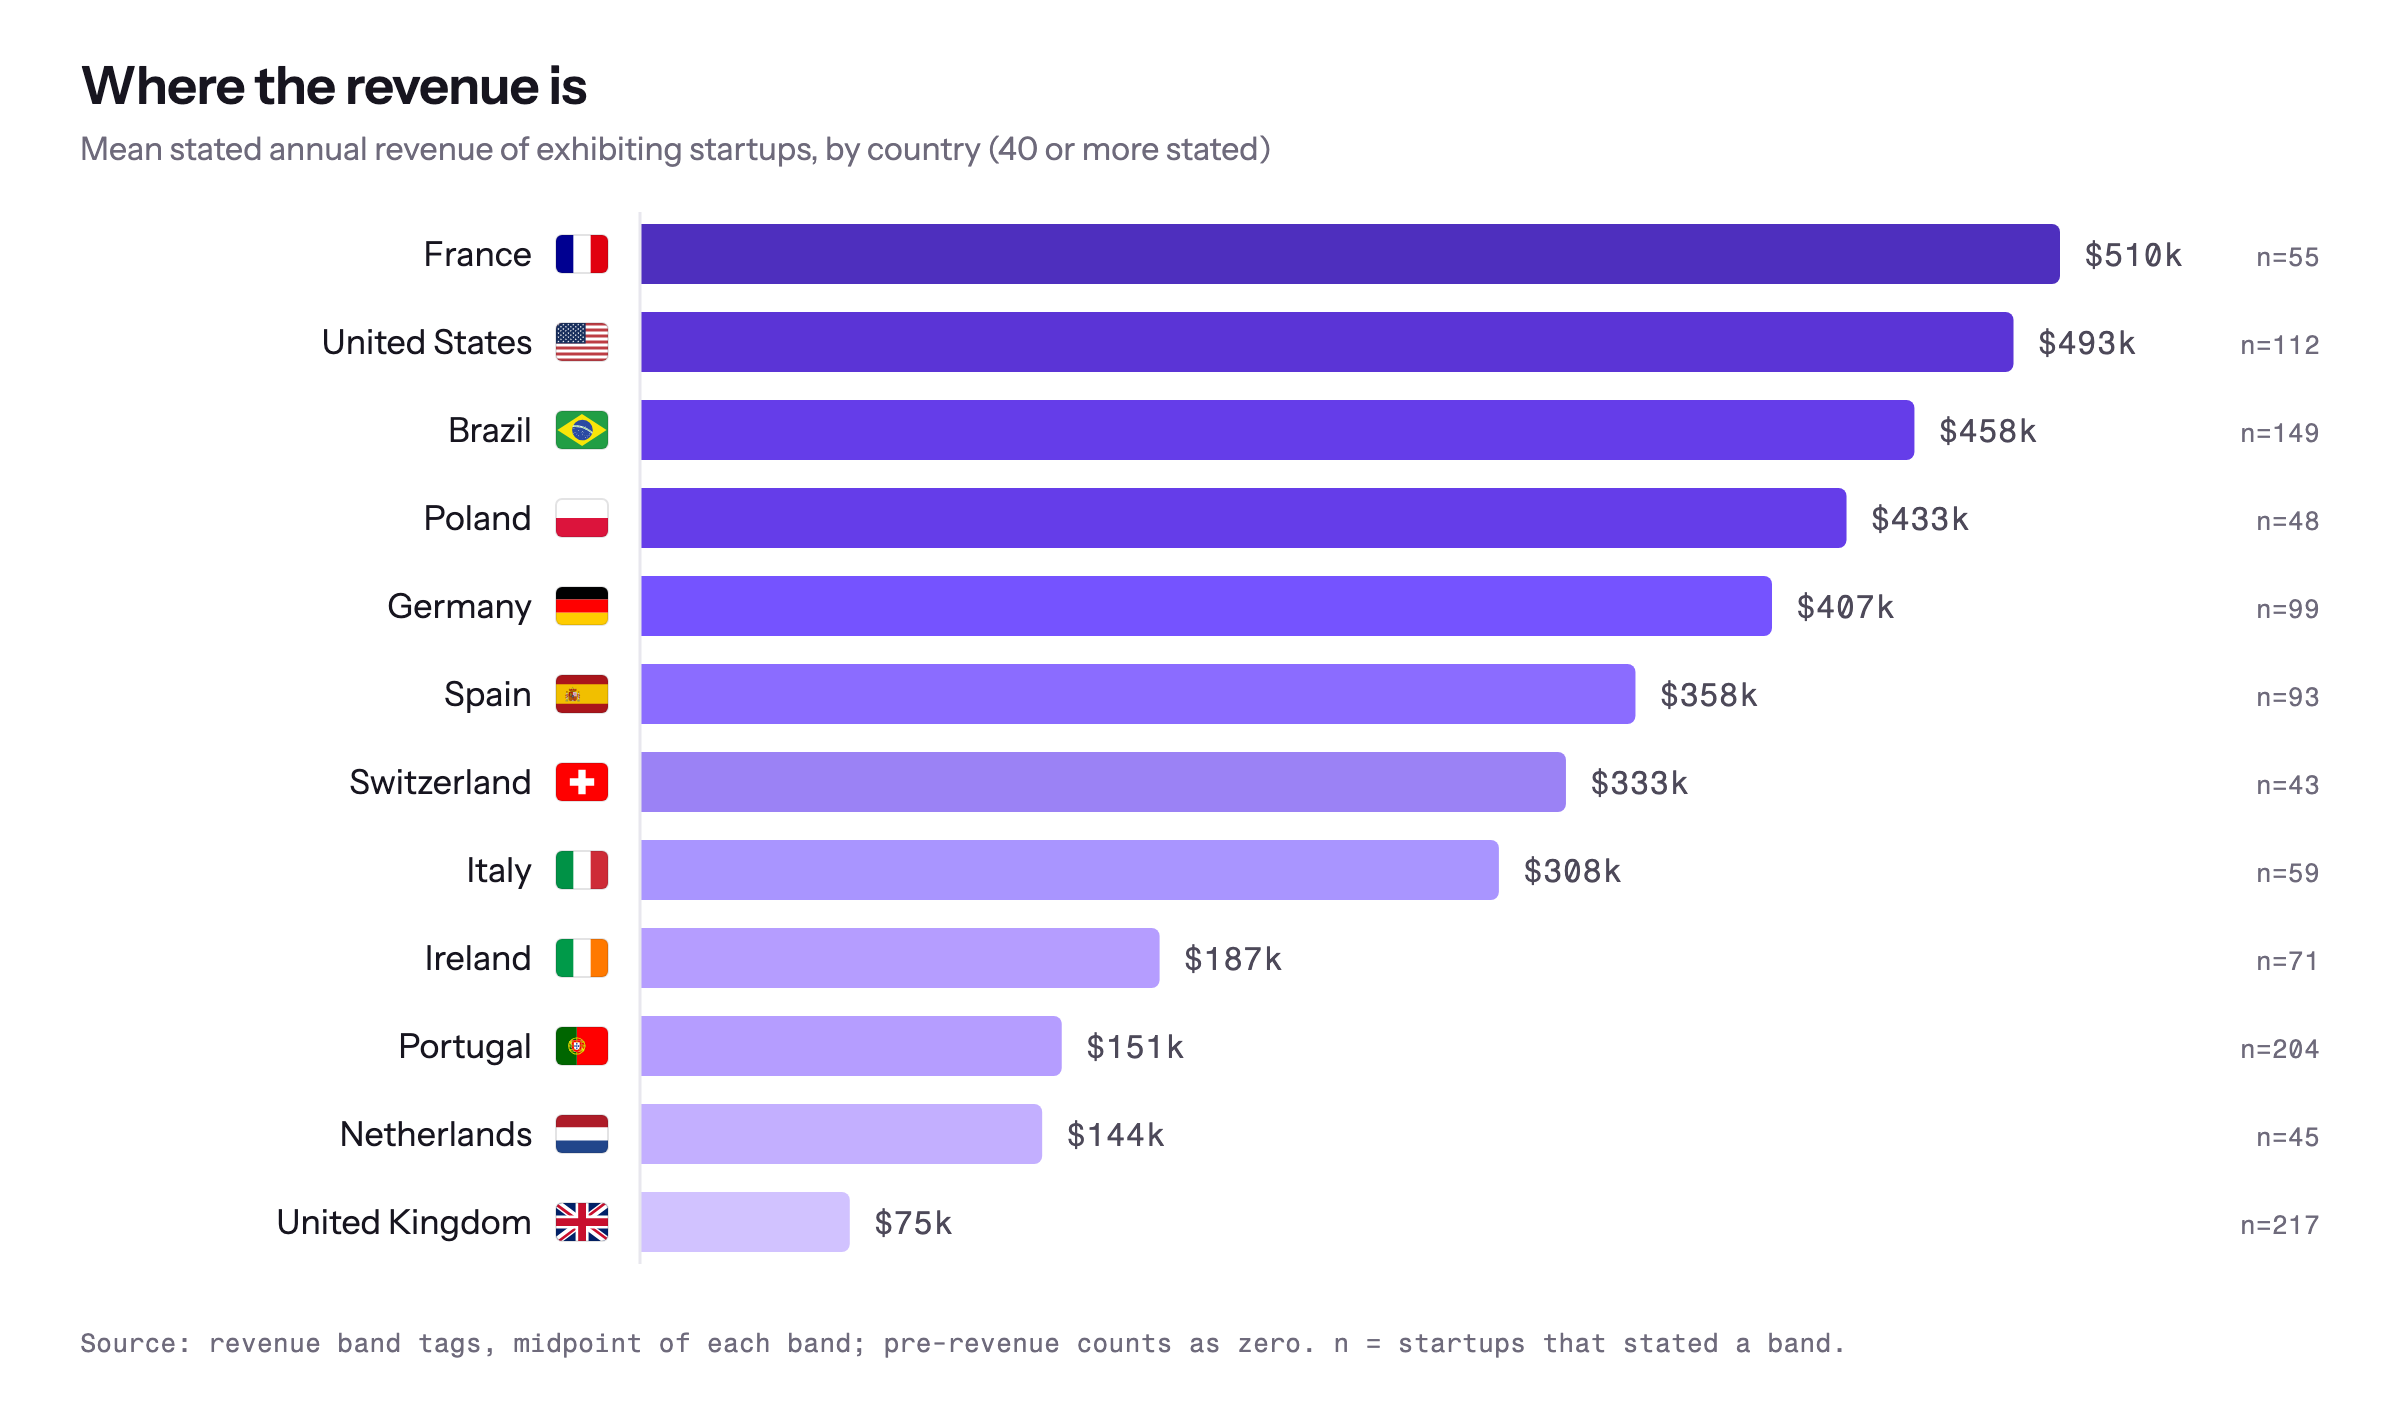
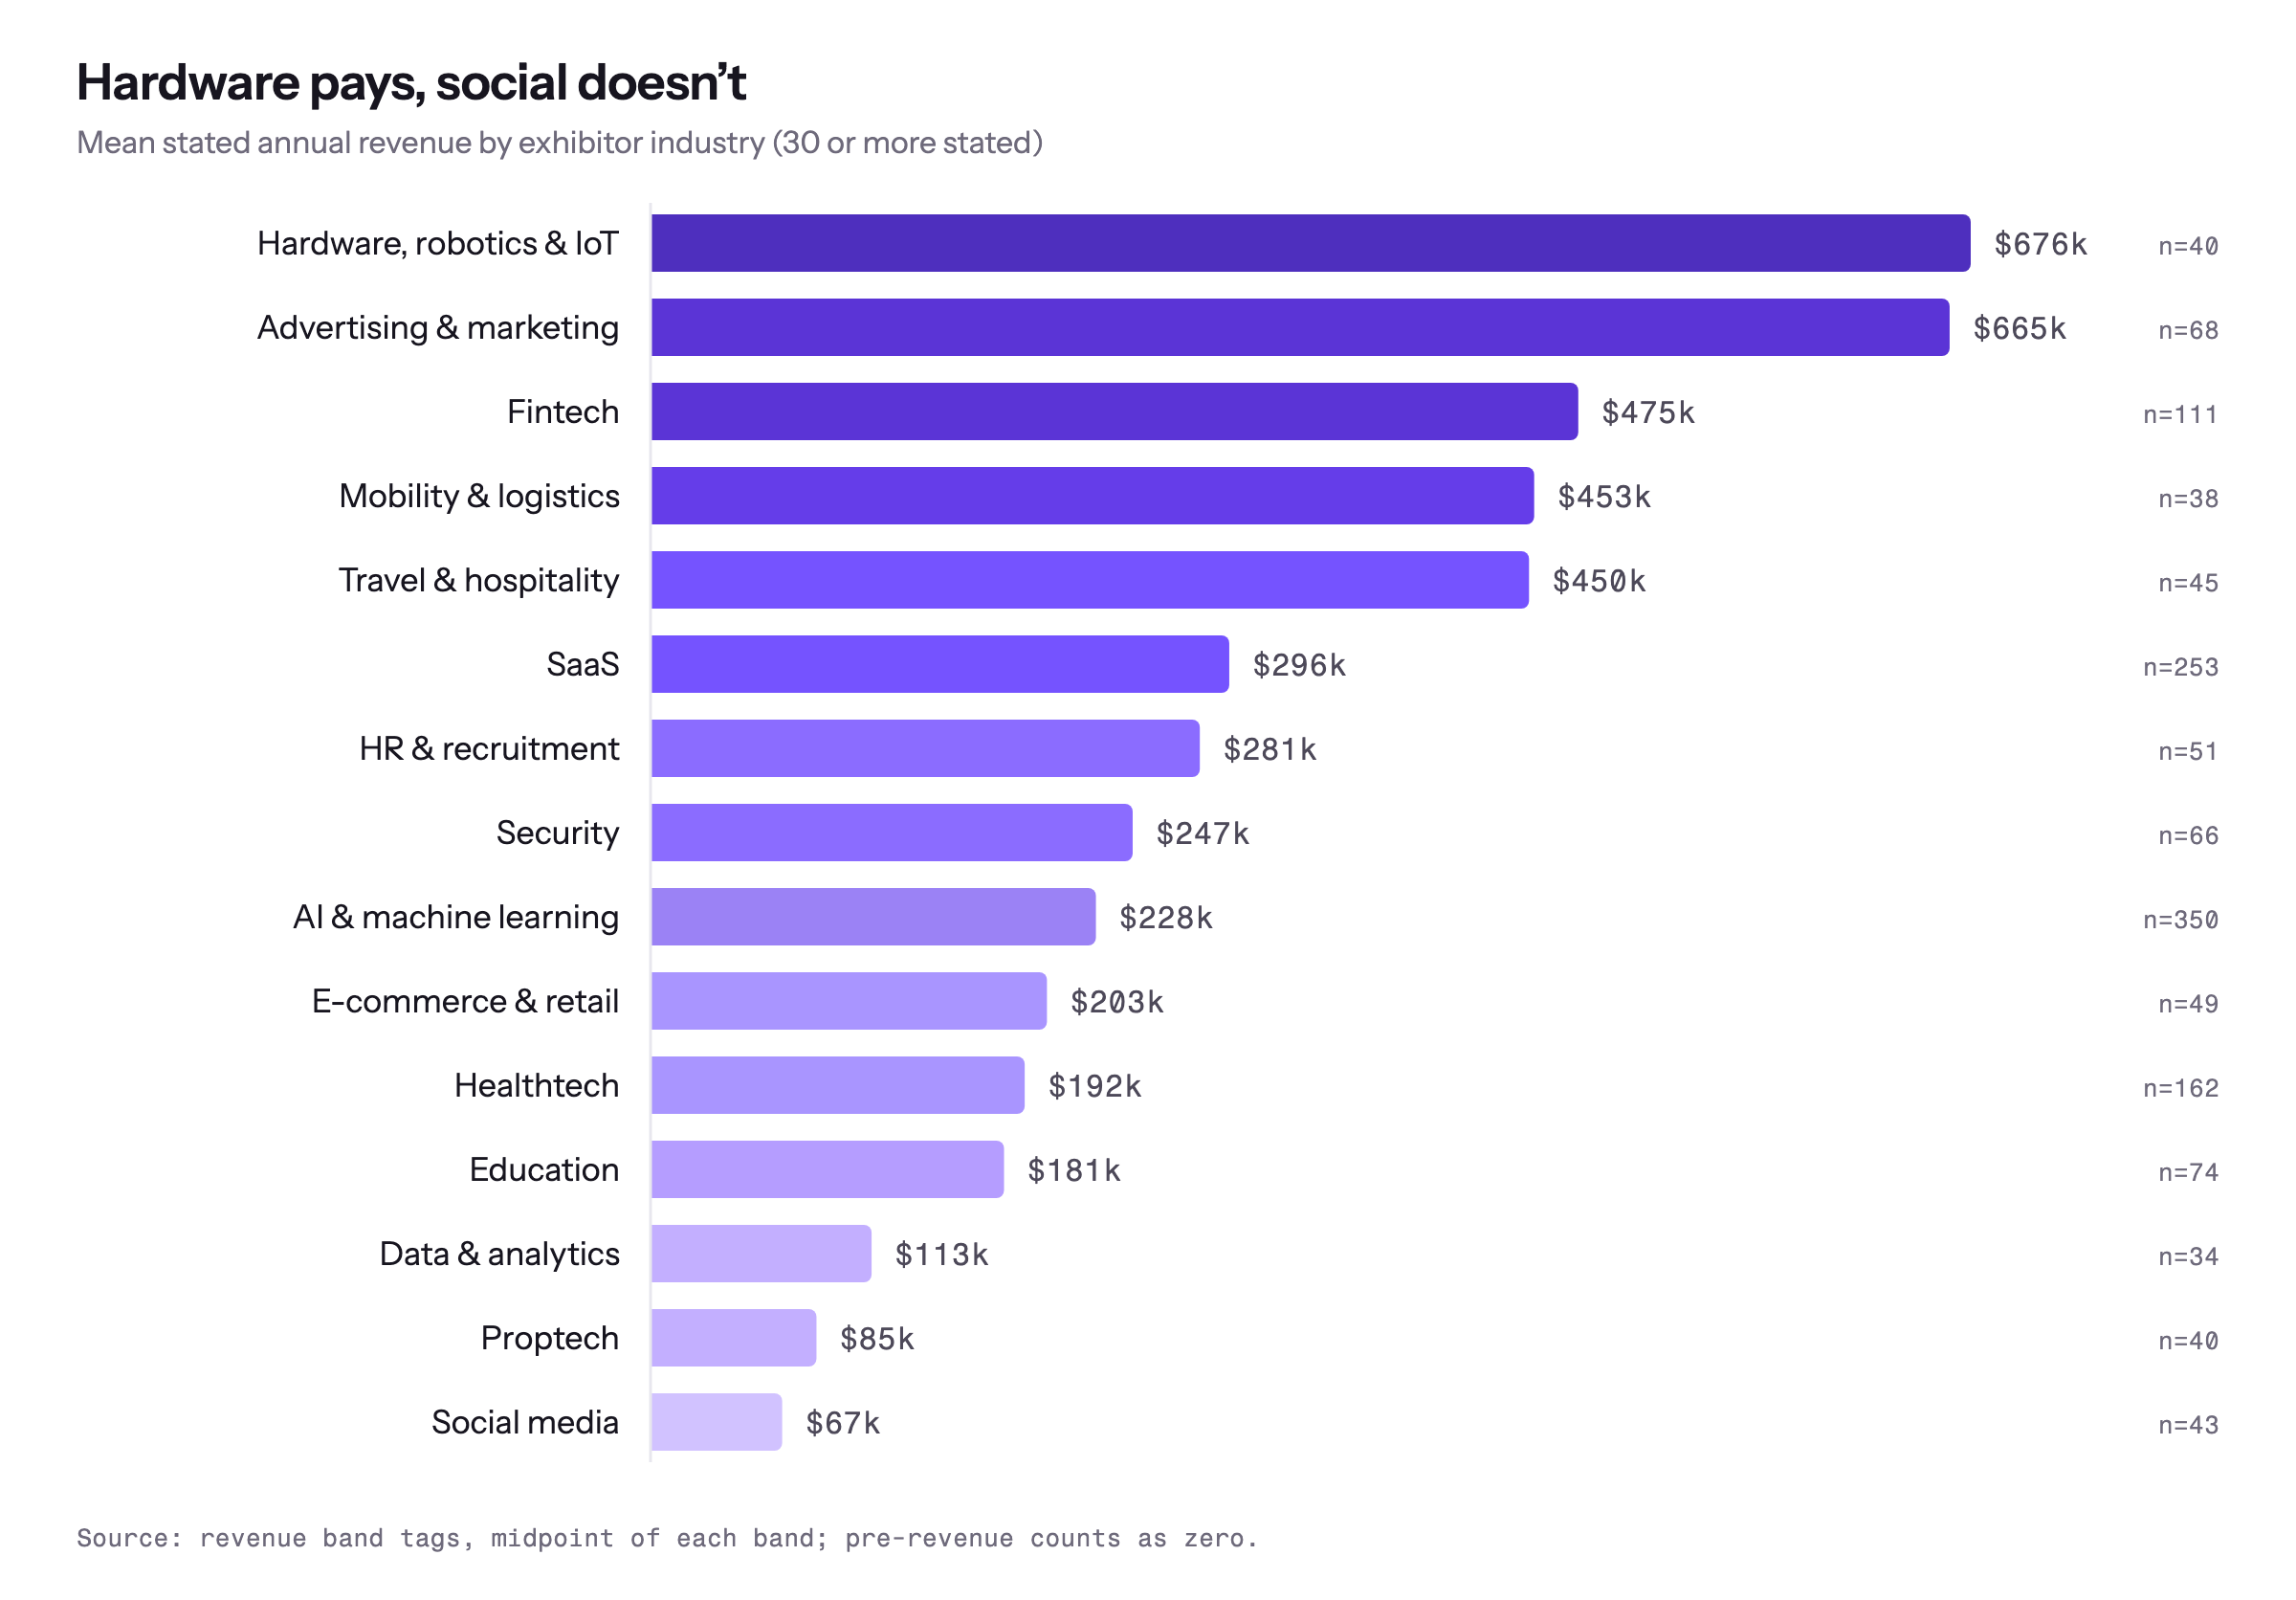
Here is the rest of what moves together in the self-reported tags, with the usual warning that these are correlations in a conference directory, not causes. Revenue is each startup’s stated band at its midpoint, with pre-revenue as zero.
Revenue follows the passport. French, American and Brazilian exhibitors report the most; British exhibitors report the least, by a distance. Partly that’s stage: 58% of UK startups here are pre-revenue, against 18% of Brazilian ones.
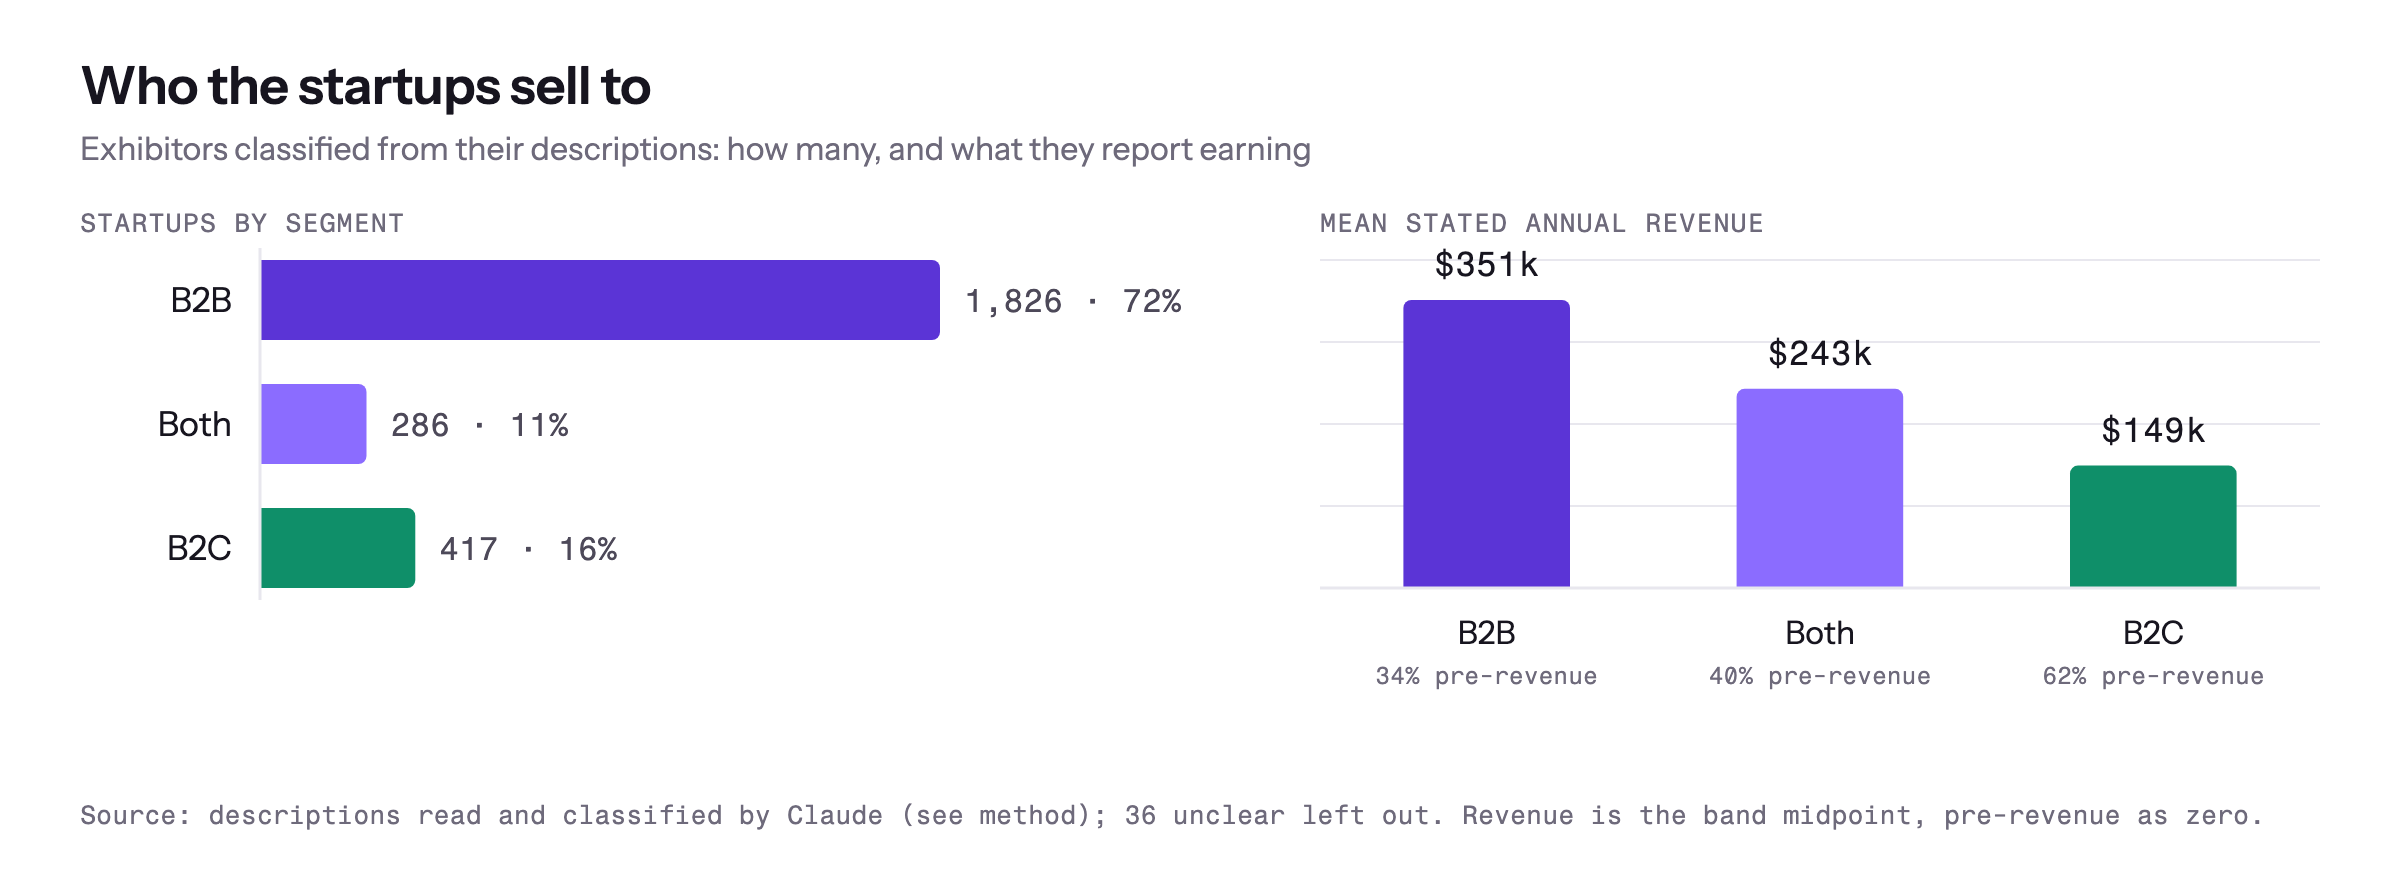
B2B is the room. Web Summit doesn’t ask startups who they sell to, so we read every description and classified it (method below). Seven in ten exhibitors sell to businesses, one in six to consumers, one in nine to both. B2B startups report more than twice the revenue of consumer startups, which are far more likely to be pre-revenue (62% against 34%) and a little more likely to be raising (63% against 51%). The AI label lives in B2B too: 60% of B2B descriptions mention it, against 43% of consumer ones.
Advertising pays. Social doesn’t. Advertising and marketing exhibitors report the highest average revenue, with hardware and robotics a whisker behind. “AI & machine learning” and “Data & analytics” sit in the bottom half, and social media is last.
Bring the team. One or two people on the stand report about the same revenue. Three is noticeably more, and four or more is almost four times a solo stand.
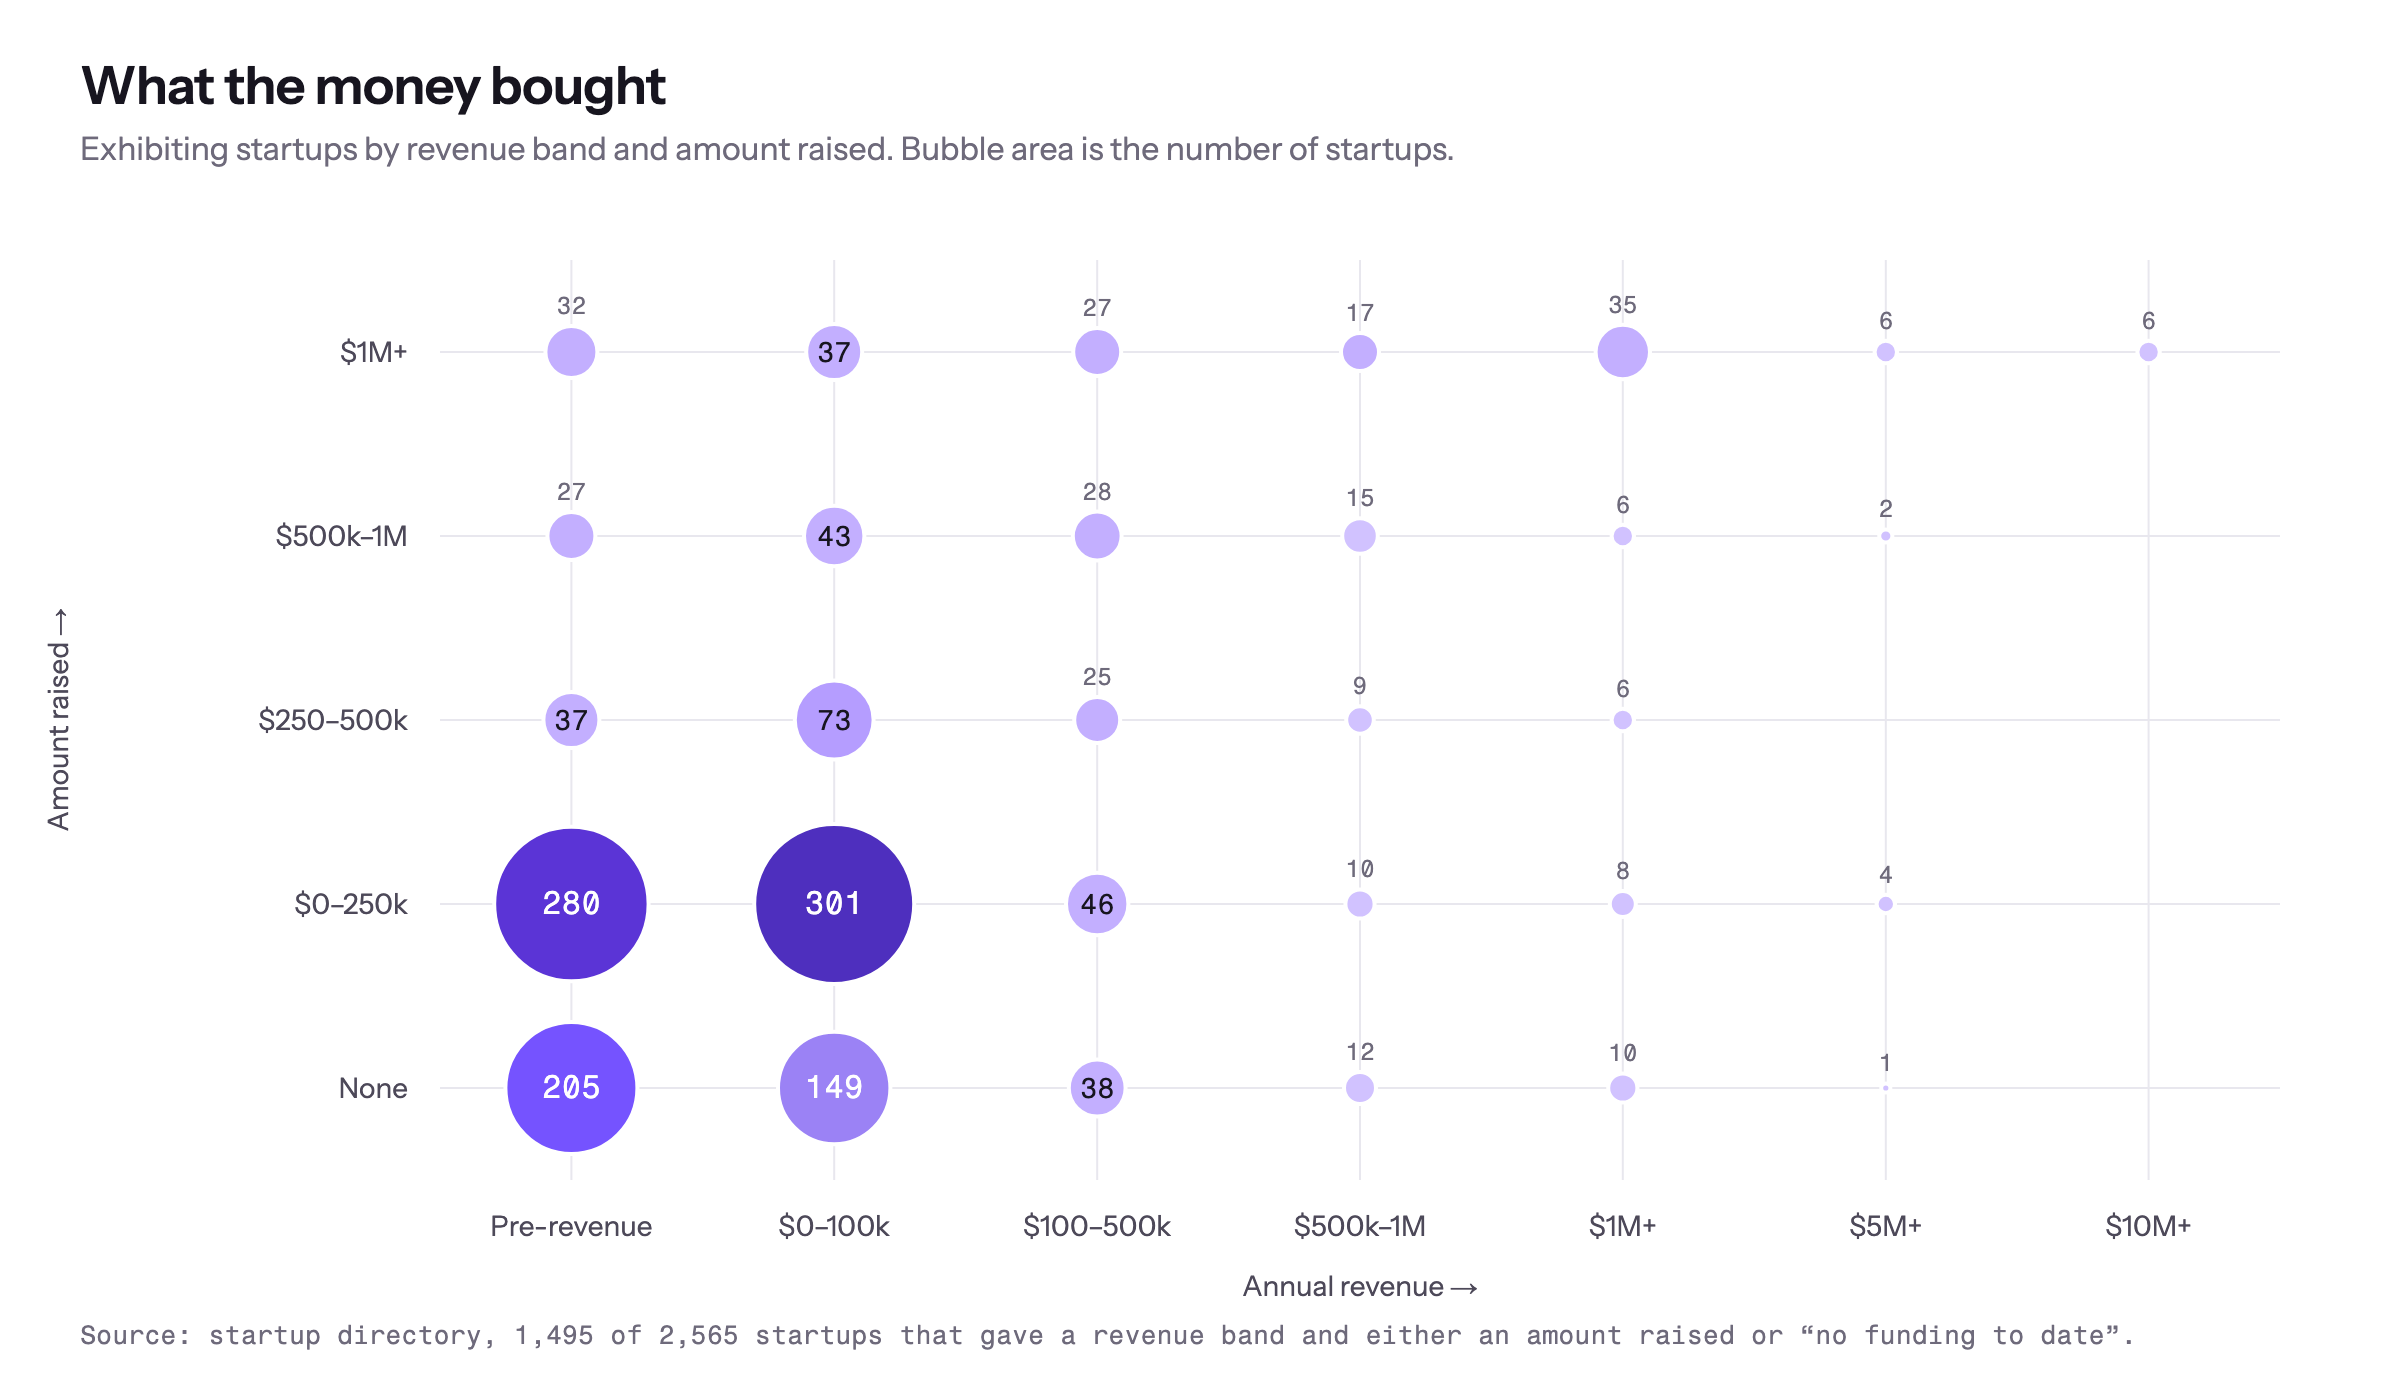
Money raised and money made barely know each other. 75% of pre-revenue startups say they’re actively raising, and so do 76% of the ones with revenue. 942 of the 1,513 startups that answered both are pre-revenue or under $100,000, and have raised under $250,000 or nothing. Of the 161 that have raised a million or more, 69 are under $100,000 in revenue. Of the 86 making over a million a year, 23 have raised less than $250,000, or nothing.
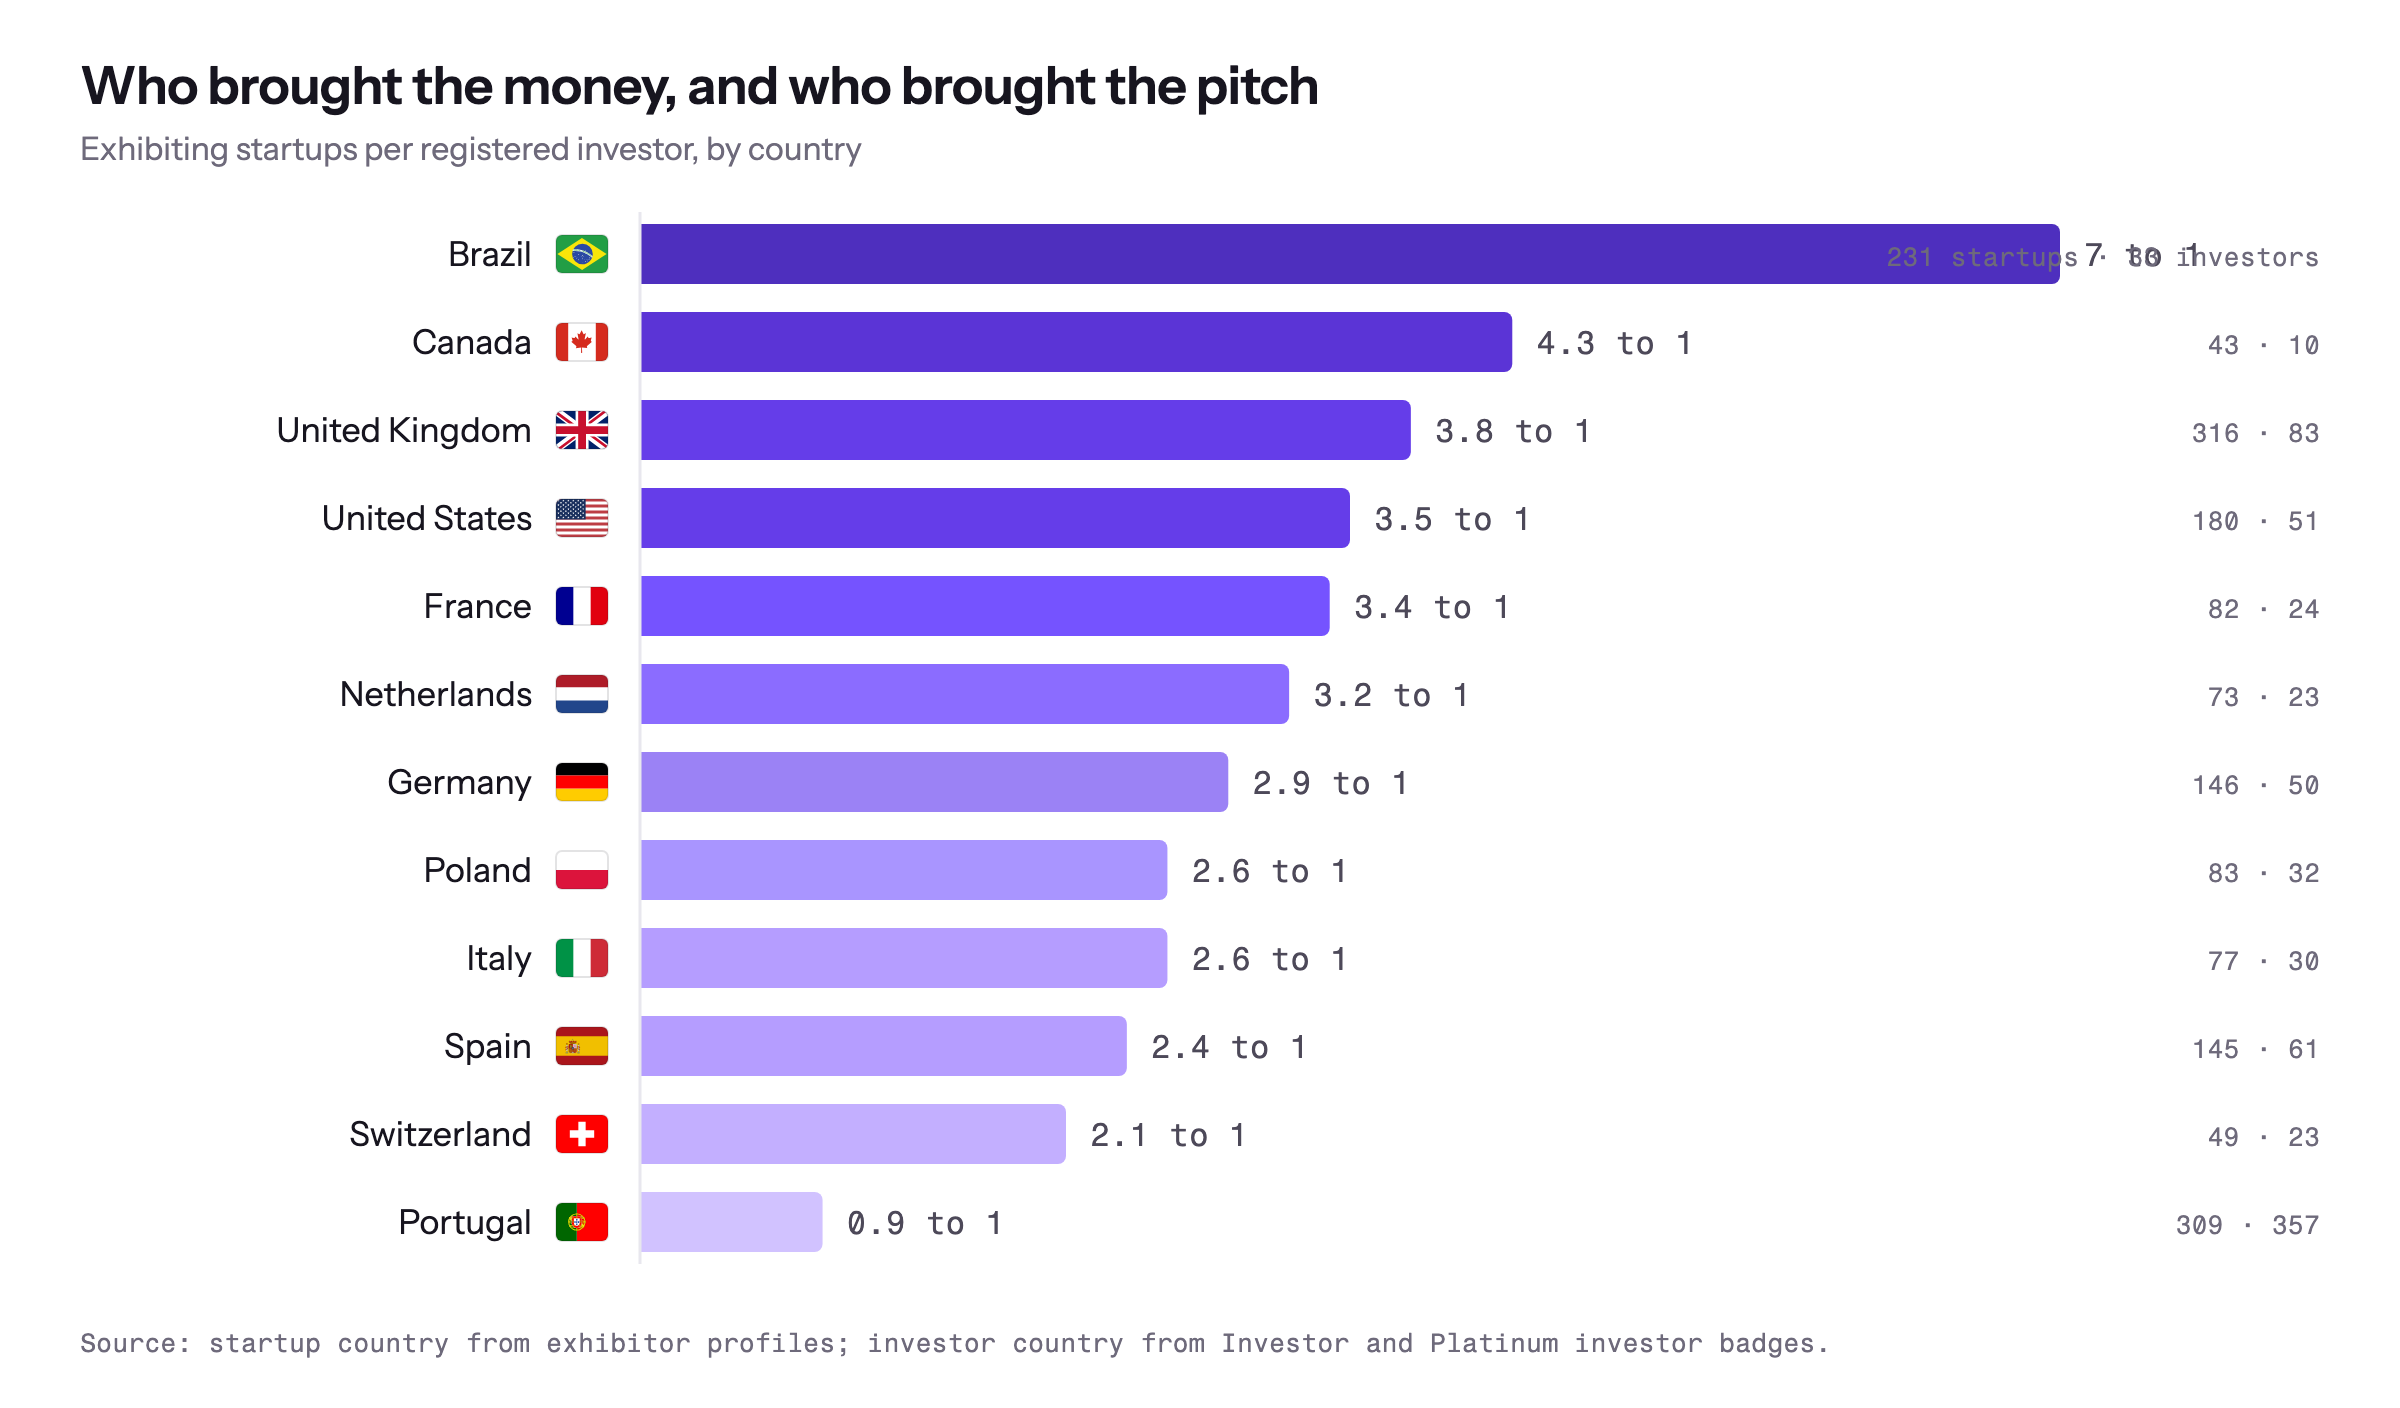
Portugal brought the investors. The directory shows 991 investors, 314 with a platinum badge: 2.6 exhibiting startups for every investor. But 357 of those investors are Portuguese, against 315 Portuguese startups, so the hosts have more investors than startups. Every other country is the other way round: Brazil has seven startups per Brazilian investor, the UK and US just under four.
When to start messaging
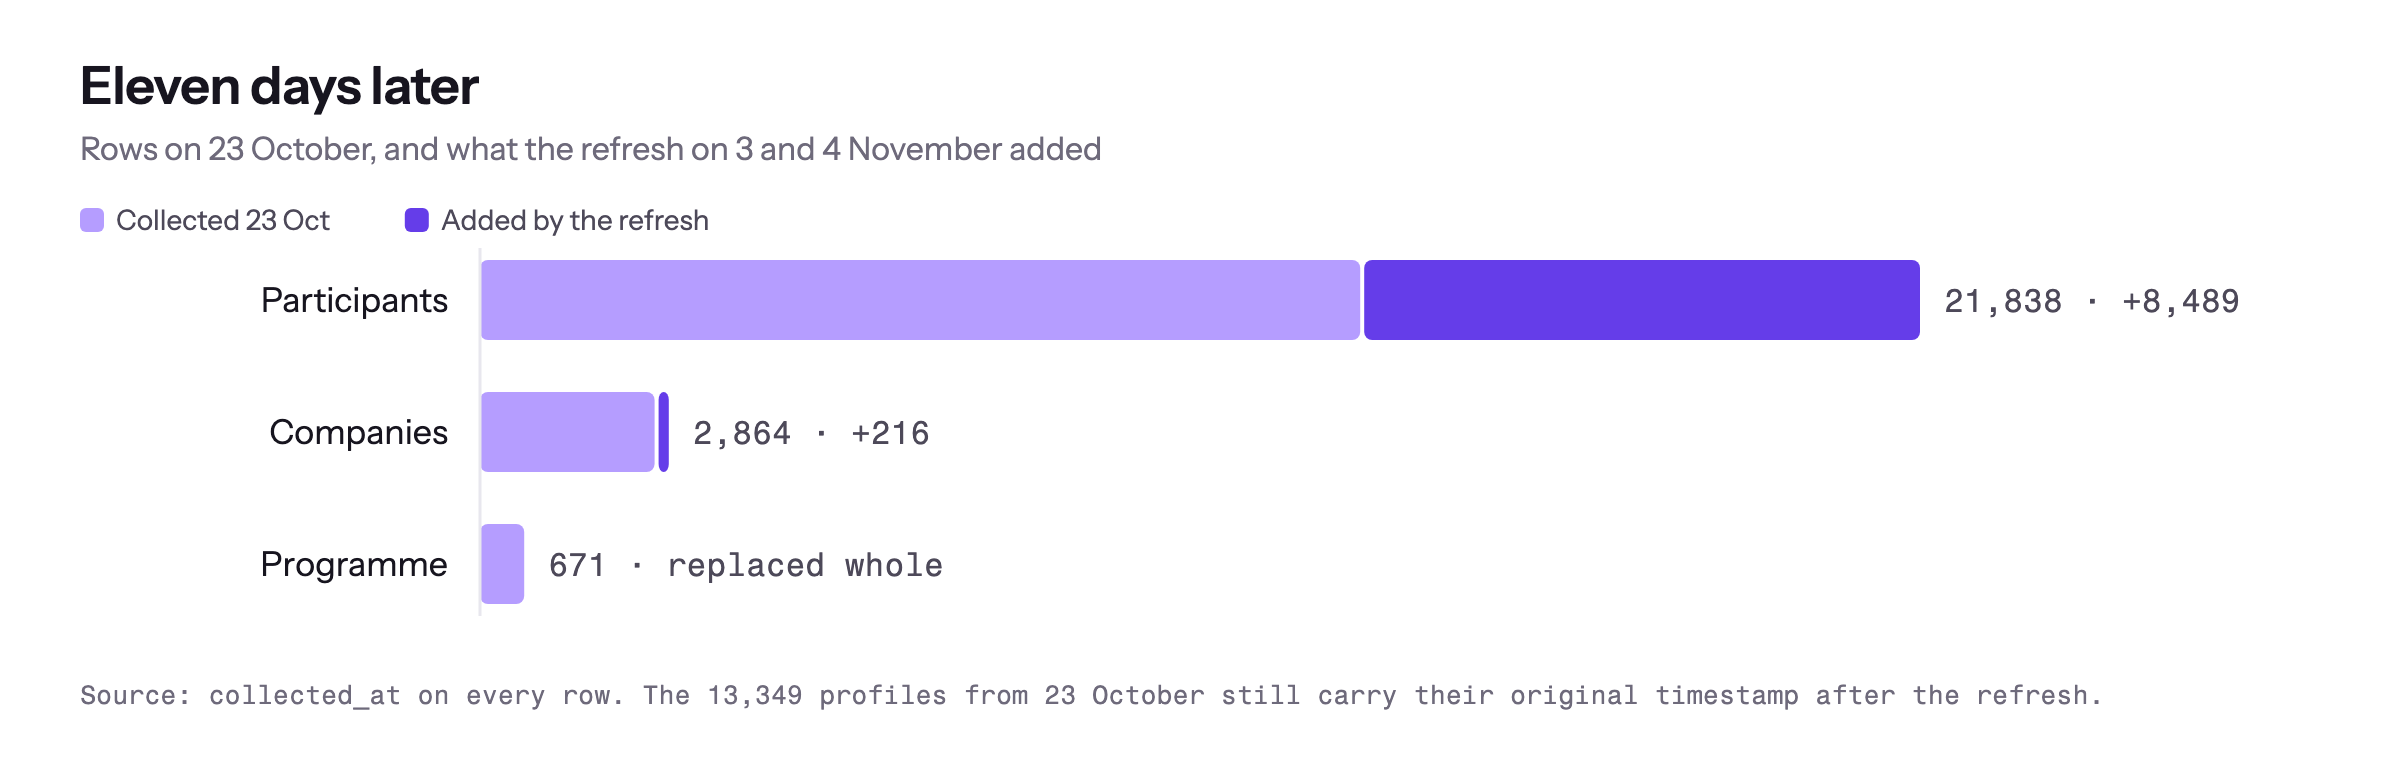
We read the directory three times before writing this: 23 October, 3 November and 4 November, with the companies and programme again on 8 November. Index each table to its October size and the shape is clear: the exhibitor list was 90% complete three weeks out, while the attendee directory grew by two thirds and the programme by three quarters. The last day we read it added 1,848 people. If the pace holds, the directory passes 25,000 as the doors open.
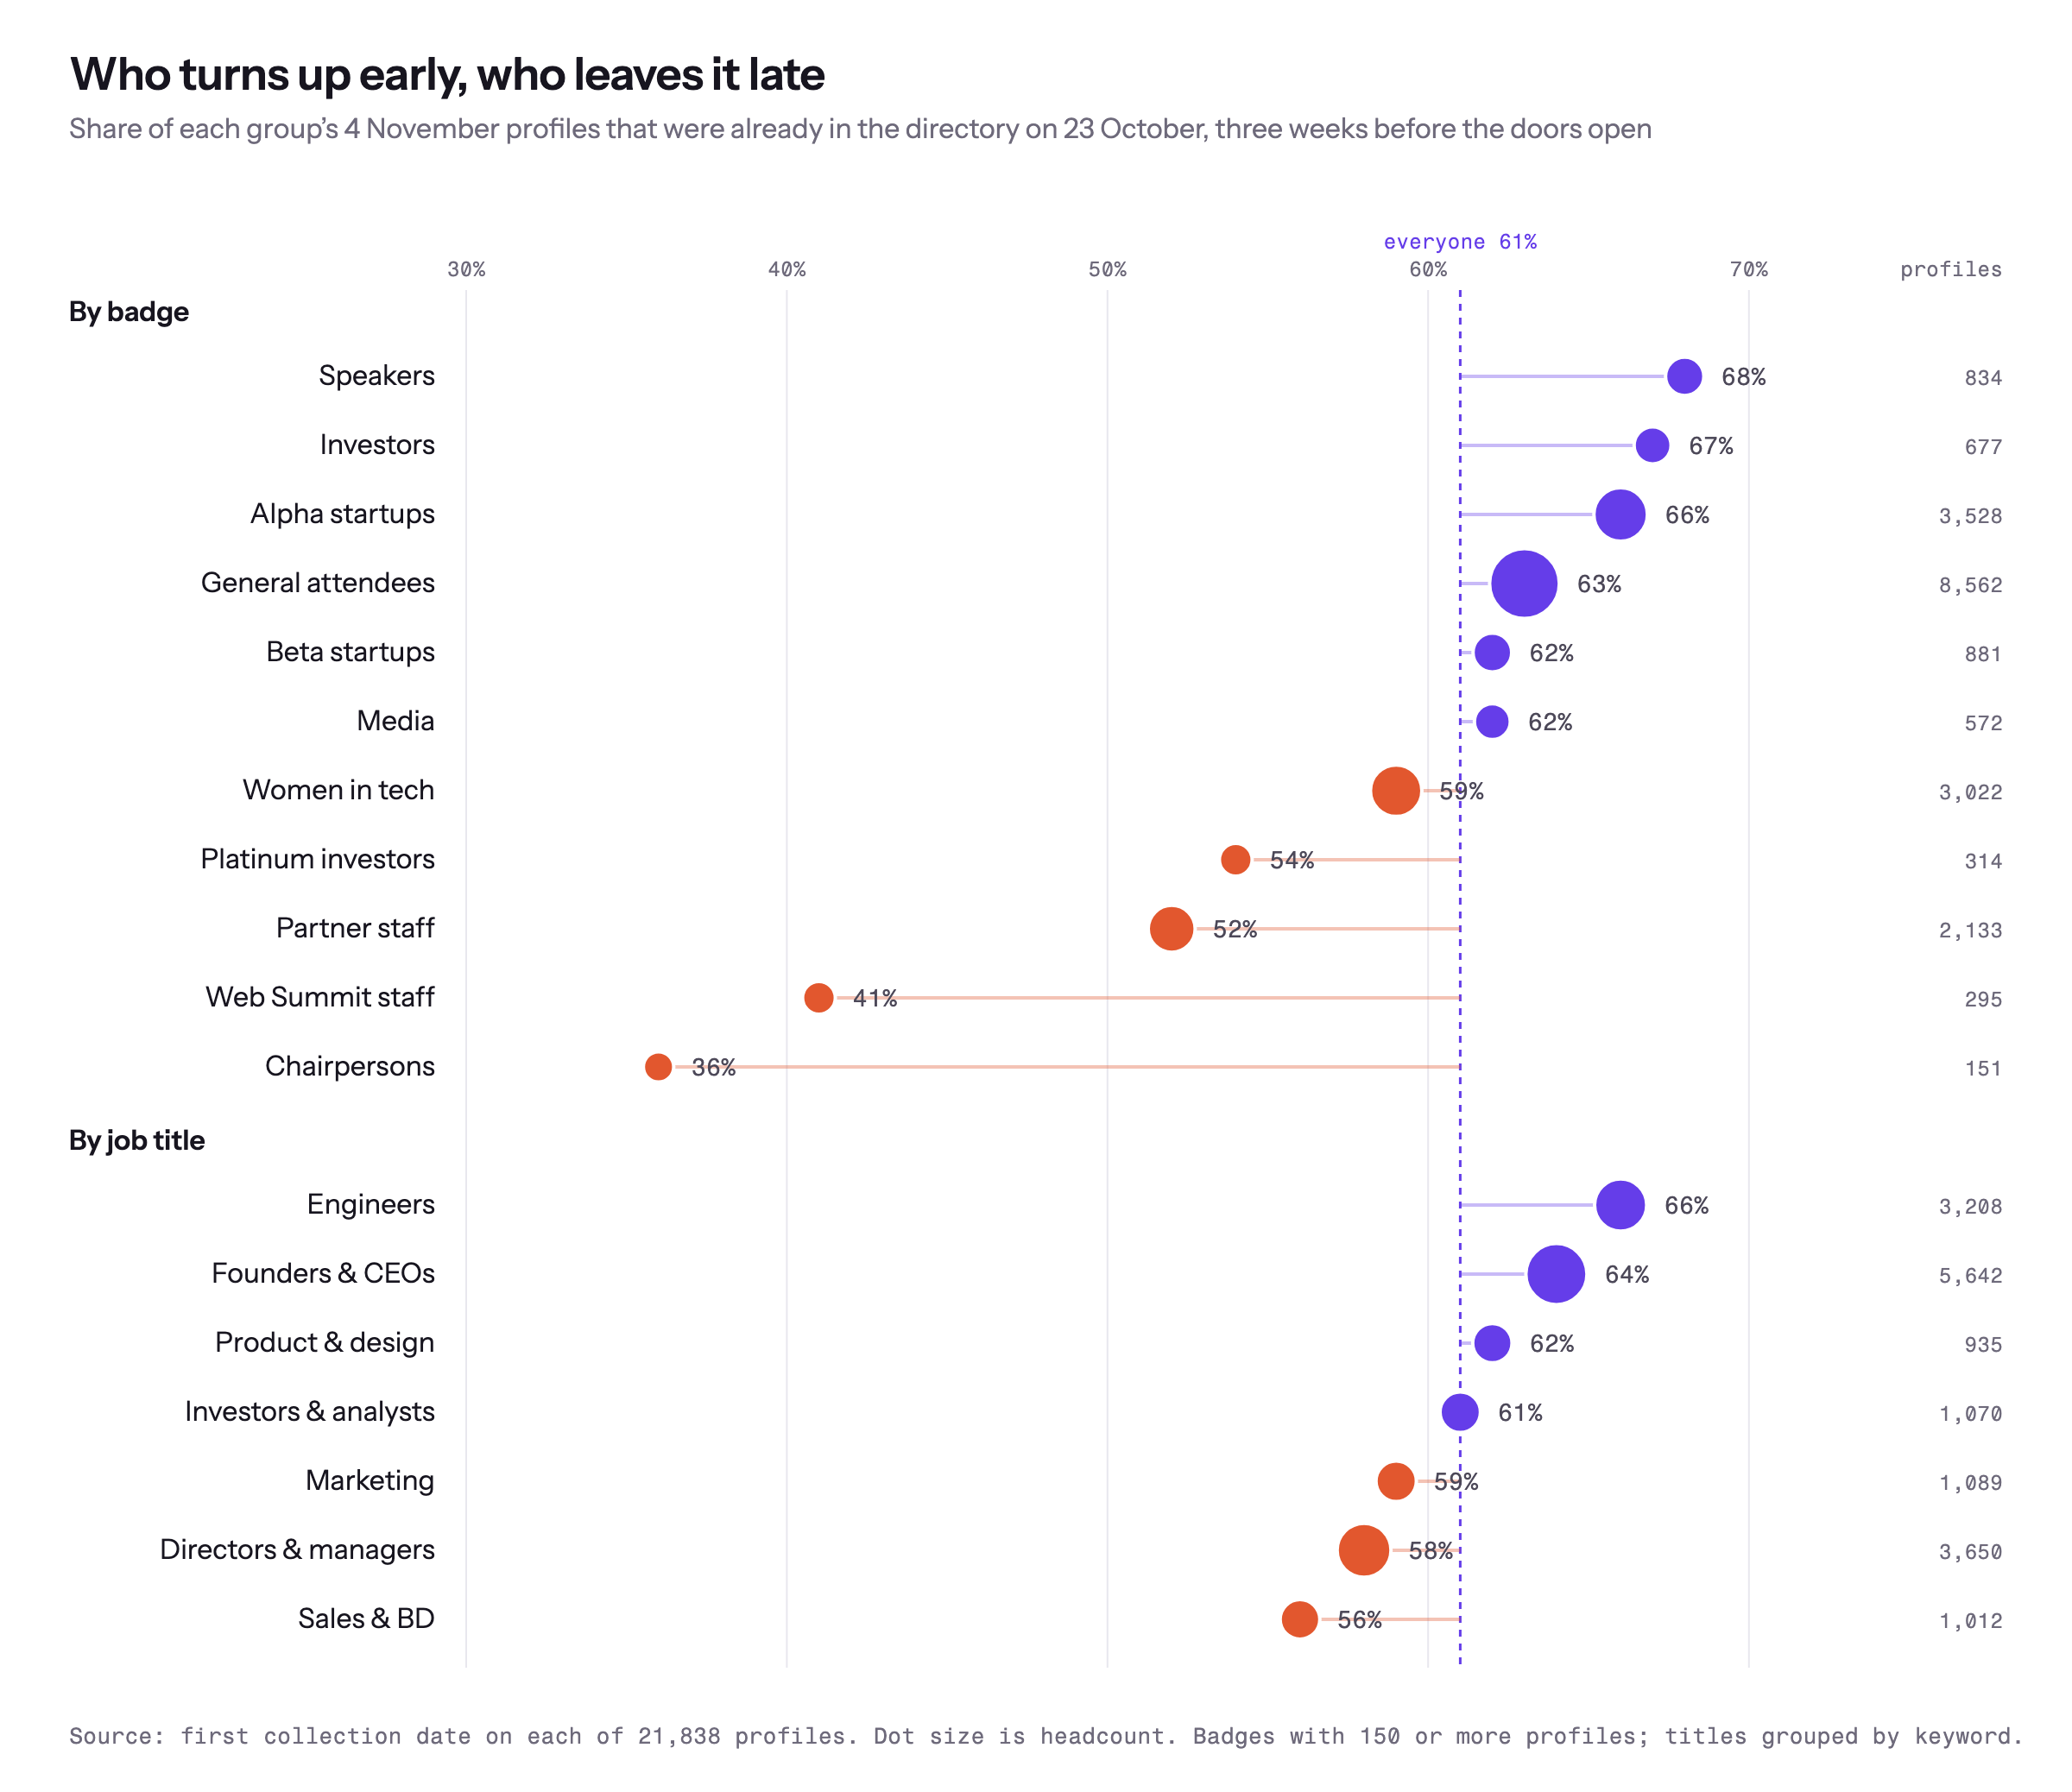
Every profile carries the date we first saw it, so we can also tell who is in the app early and who leaves it late. Three weeks out, six in ten of the eventual directory were already there, but not the same six in ten for every group. Speakers, investors and exhibiting founders register first, two thirds of them by 23 October; engineers are the earliest job title. Sponsor staff, platinum investors and chairpersons arrive in the final fortnight, and sales and business development is the latest title of all. So: message investors and founders in October, when they are in and the inbox is quiet, and wait for the last two weeks to reach sponsors and senior executives, because half of them did not exist in the app before November. Expect the late surge to be sellers.
What we did with it
This wasn’t an exercise. We built the dataset to decide who to meet.
Coming soon
An updated post after the conference
Who we met, how the dataset picked them, and what we built for each of them before we sat down. Back here the week after Web Summit.
How we collected it
Some notes on method, because we’d want them from anyone else.
The source. The Web Summit attendee directory at attend.websummit.com: attendees who have made their profile visible, exhibiting companies and the programme. There is no API; Jason read the web interface, carefully and politely, into three tables.
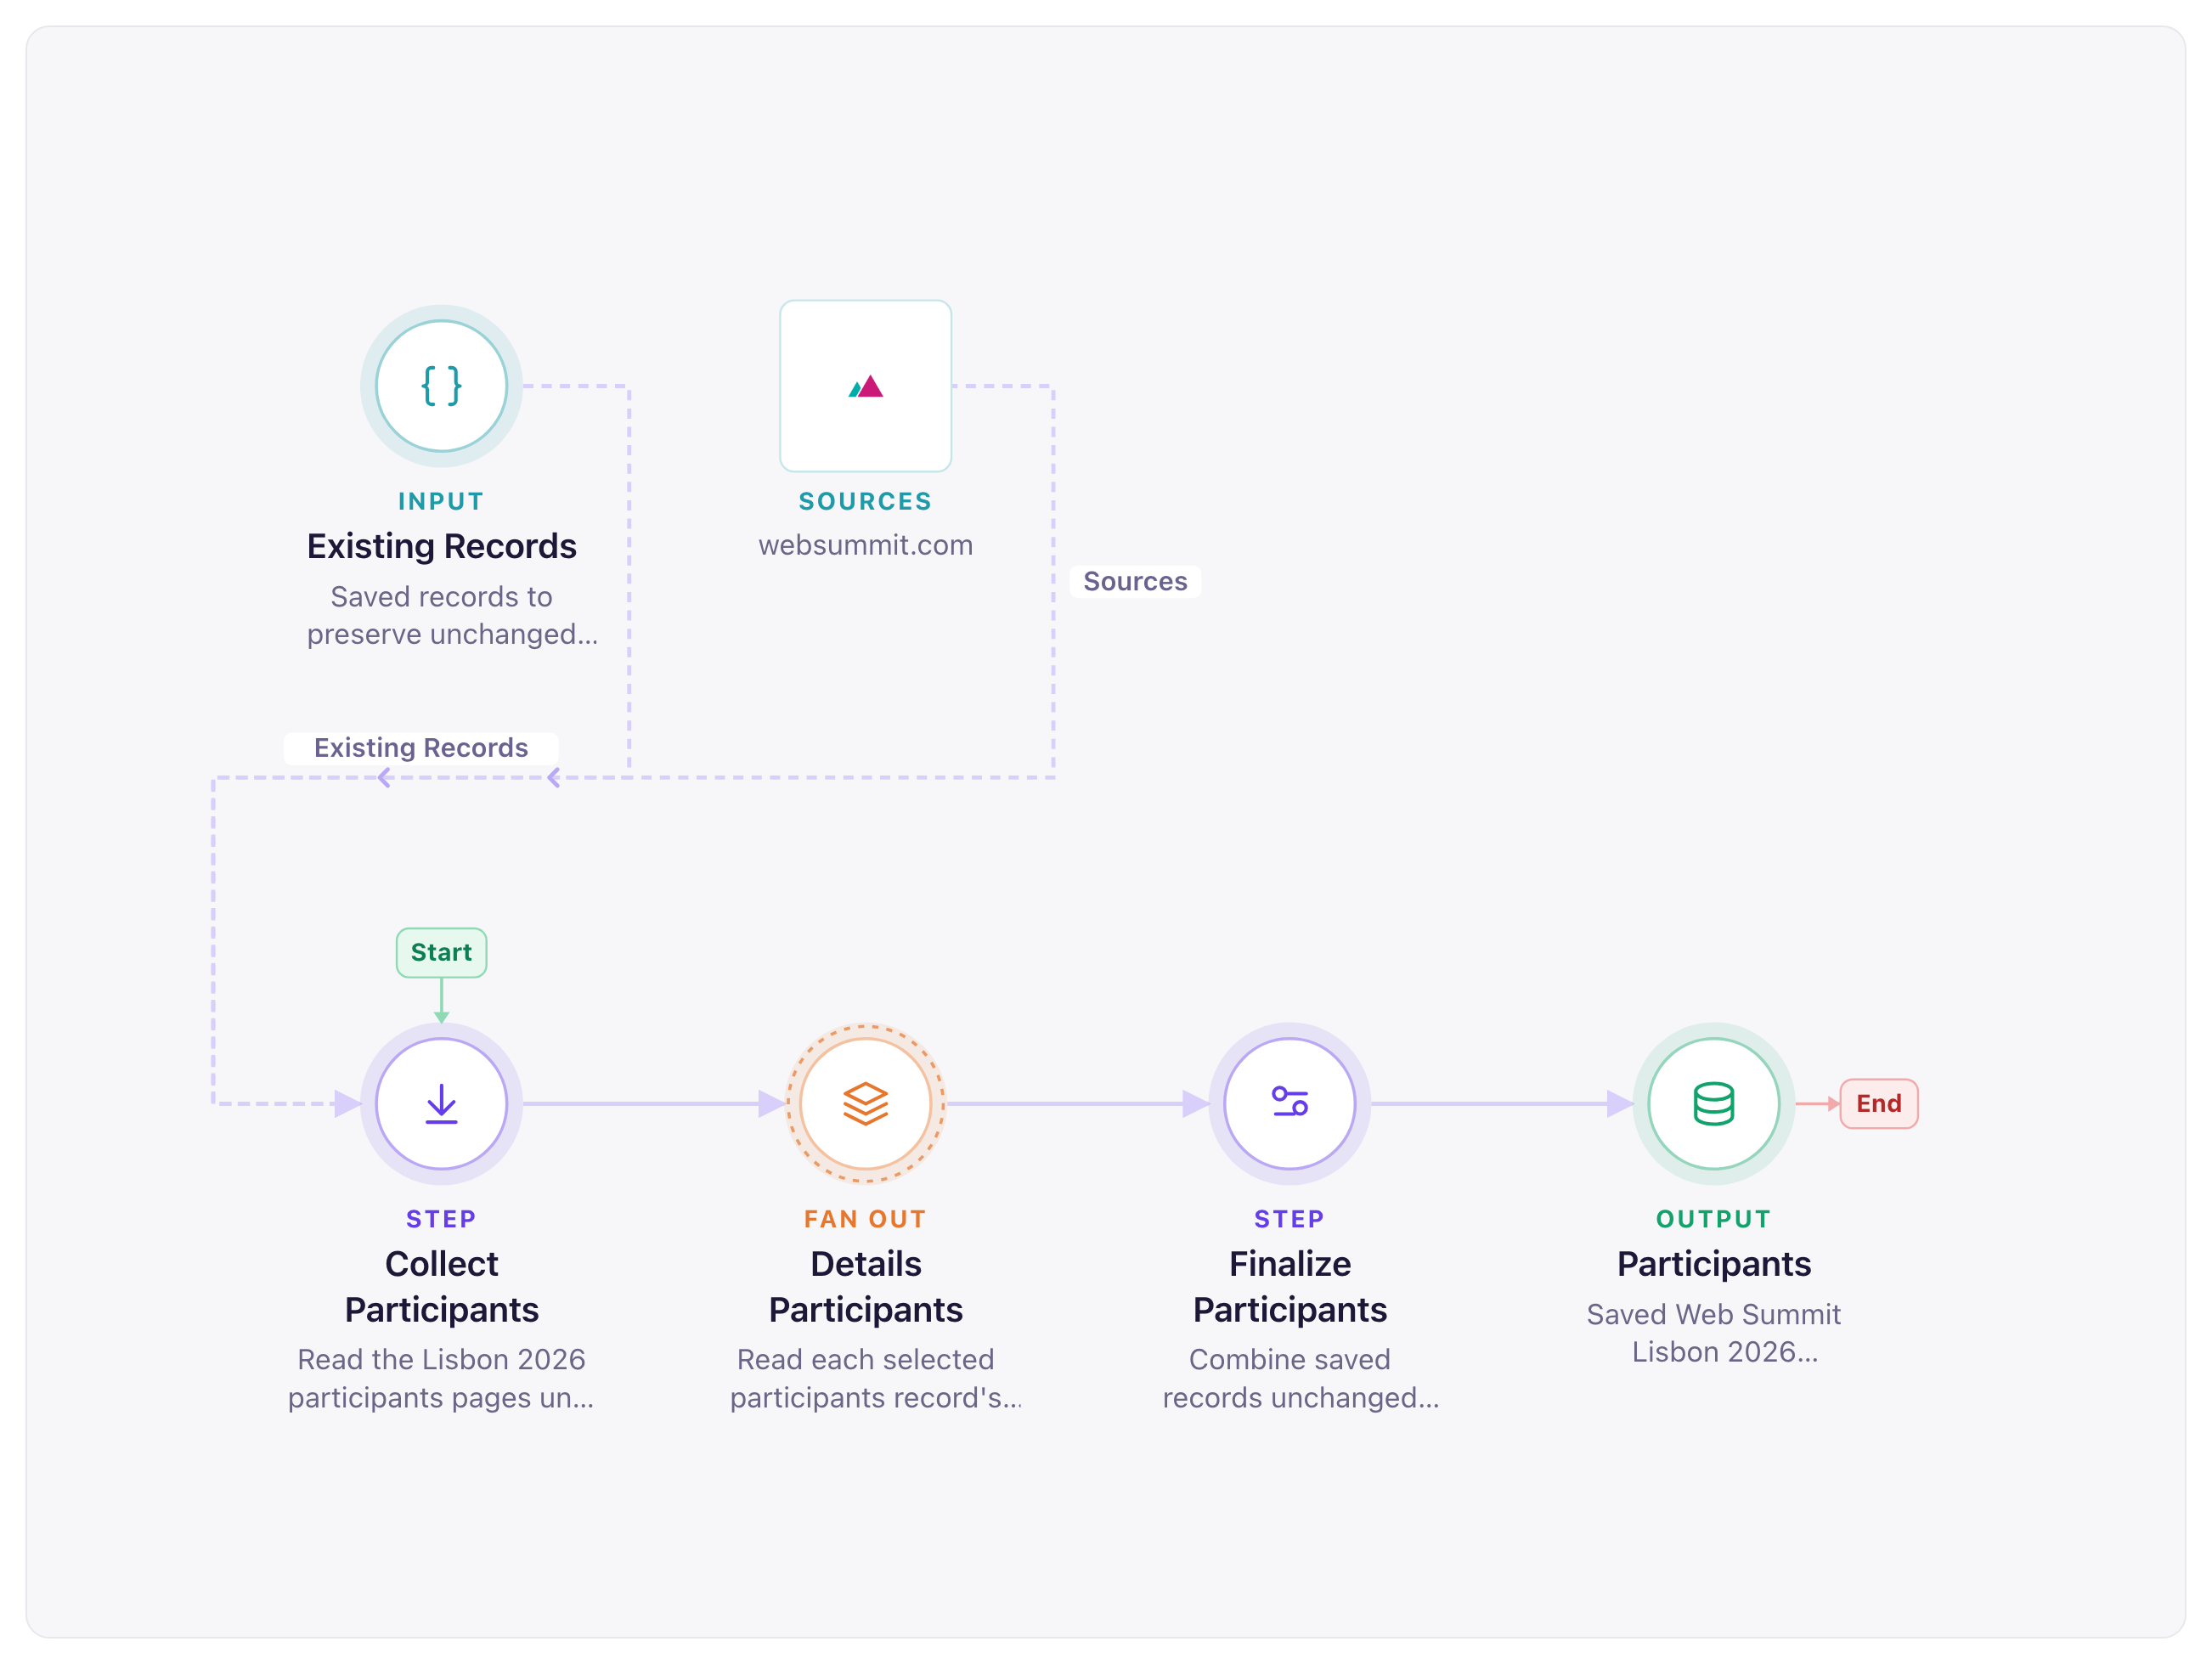
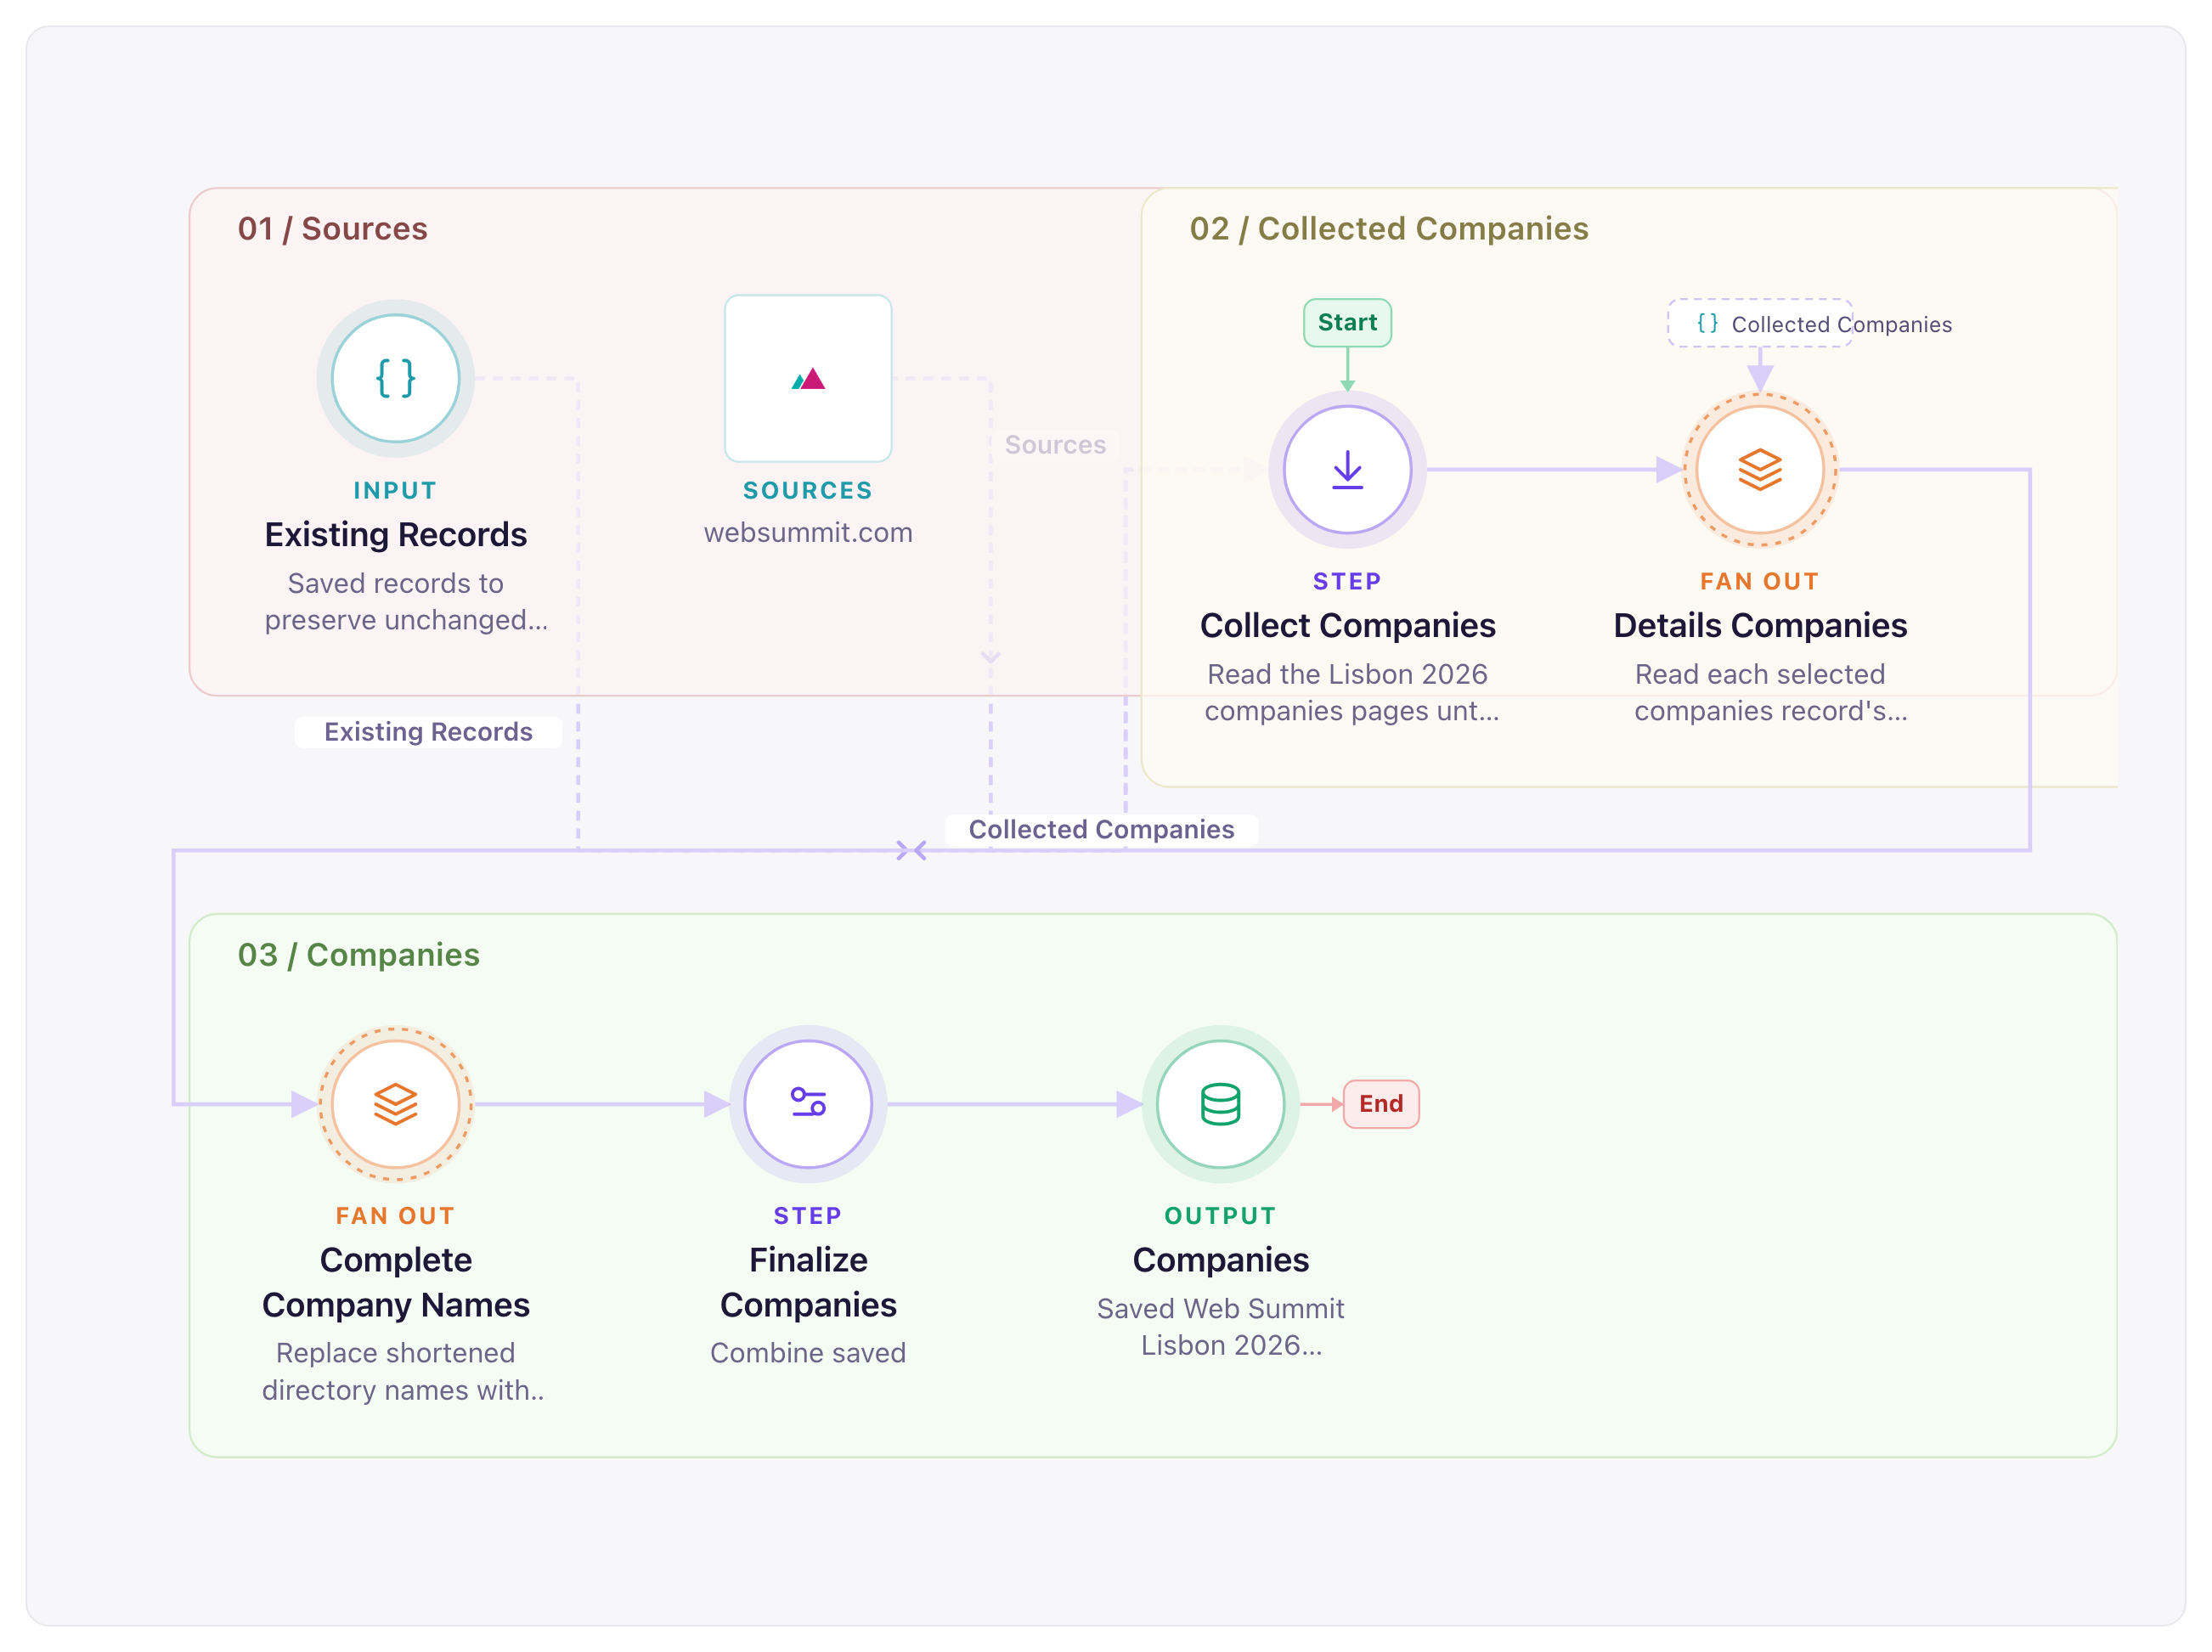
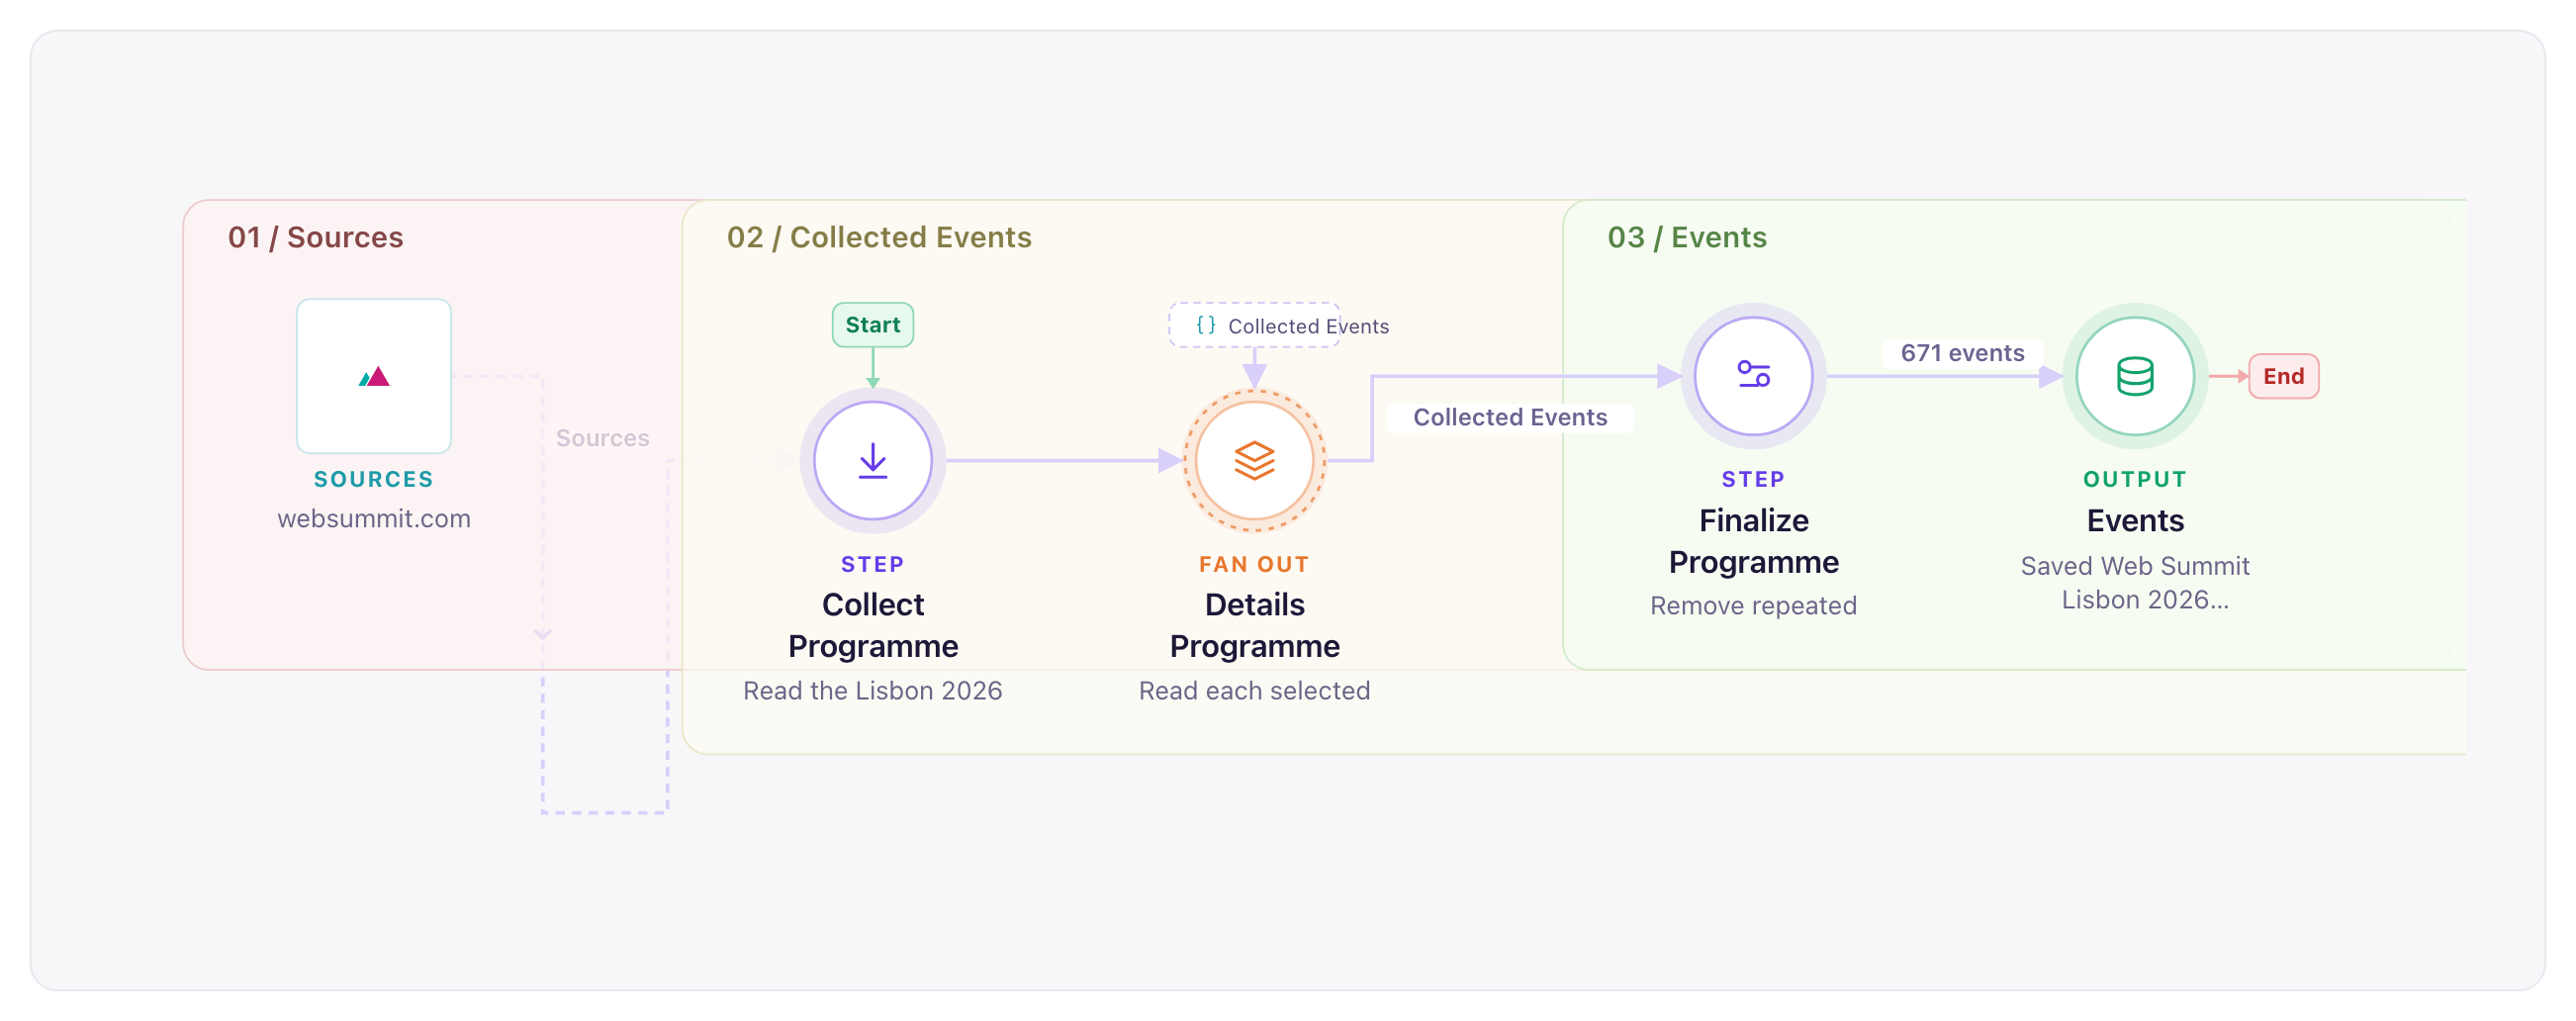
The pipelines. One per table. Each reads the directory listing until it runs out, fans out to read each profile, then merges with what was already saved, deduplicated on Web Summit’s own IDs. That last step is why a refresh adds rows without touching the ones we had.
The refresh. The first run on 23 October gave us 13,349 attendee profiles, 2,648 companies and 671 sessions. On 3 November the message was just “refresh them”. Jason matched every profile on Web Summit’s own ID and added 8,489 attendees and 216 companies; the 13,349 rows from the first run were not touched, and every one still carries its 23 October timestamp. That is the part a weekend scraper cannot do. Anyone can pull a directory once; the second run is where self-built collectors die, in duplicates and overwrites. Jason’s pipeline carries the rule in its own words: “Discover all available records by default, fetch details only for new identities, and retain all previously saved records unchanged.” The refresh took one message and no code.
The fine print: snapshot dates, what a row is, how we counted, and what's not in here
The snapshot. Participants: 23 October, refreshed 3 and 4 November. Companies: 23 October, with 216 added on 3 November and 46 on 8 November. Programme: 8 November; the 23 October version had 671 entries. Everything here describes the directory on those dates, not the final event.
What a row is. A participant is one profile, keyed on Web Summit’s ID: name, job title, company, country, industry, participant type, biography. A company is one exhibitor profile: tier, country, industry, description, website, team and the self-selected tags for revenue band, amount raised, markets and fundraising. An event is one programme slot: format, track, venue, start time, duration, speakers.
B2B or B2C. Web Summit has no field for it, so Claude read each of the 2,604 startup descriptions with one rule: B2B if the customer is a business, organisation, government or professional at work; B2C if it is an individual, patient, parent, player or household; both if it clearly serves both; unclear if no customer is implied. 36 came out unclear. A keyword pass agreed with the reading 70% of the time.
Product or services. The same reading, with a different rule: services if the startup sells time or custom work (development, consulting, agencies, outsourcing, training); product if it sells software, hardware or a platform; both if the description clearly offers both; other for programmes, networks, funds and the 36 descriptions with no business in them. A second flag marks startups whose customers are startups, founders, developers or engineering teams. Partners were sorted into corporate, startup, government, services, community, media and investor. One batch of 225 descriptions was read cut to 230 characters, so its services count may run a little low.
Who they work for. A random sample of 3,000 of the 21,838 attendee profiles, each read with title, company, headline and the first 320 characters of the biography, and sorted into startup, services firm, freelance, corporate, investor, public sector, academia, student, media, organiser or unclear. Scale-ups such as Vinted or DeepL count as startups; banks, telcos and manufacturers as corporate; public broadcasters as public sector. 7% were too thin to place. With 3,000 profiles the shares are accurate to about two points overall and five to eight for the country rows.
Early and late. Each profile’s first collection date, 23 October or 3 to 4 November, against the directory as of 4 November. Badge groups with 150 or more profiles. Job titles are keyword groups: engineers include CTOs, developers and architects; sales and business development include partnerships and account roles; founders and CEOs are any title containing either word. The 8 November participant run will add a third date.
Counting words. “Mentions AI” means the whole word AI, “artificial intelligence”, “machine learning” or “LLM”. “Crypto” means crypto, web3, blockchain, NFT, stablecoin, on-chain or tokenised assets, with the matches about LLM tokens or cryptography read and dropped. A founder is anyone whose job title contains the word, so co-founders count. Word clouds count the texts a word appears in, not occurrences, after removing common words and job titles. Treat the percentages as accurate to a point or two, not a decimal.
Technical or commercial. Technical if the job title contains an engineering, developer, data, product, design or CTO word; commercial if it contains a sales, marketing, growth, business development, partnerships, communications or revenue word. Titles matching both or neither are left out, which removes founders, CEOs and investors. 6,622 titles matched exactly one list. The chart shows countries with at least 200 attendees, exhibitors and partners; speakers, media, staff and investors are excluded.
Markets. Web Summit asks exhibitors to tick continents, so the comparison is the share of tagged startups ticking a region against the share of attendee profiles from it, with all 150 attendee countries mapped to continents by hand; Türkiye, Georgia and Armenia count as Asia, Russia as Europe. The stands chart uses logarithmic axes, so the same ratio is the same distance from the line at every size.
Stage and stand. An exhibitor has someone on the programme if a speaker’s company matches its name after stripping punctuation, or a person on its listed team is a speaker, matched on profile ID. That finds 124 of 2,910 exhibitors with the pitch rounds and Startup Showcase set aside, 666 with them in. It misses speakers whose profile names a parent company or a personal brand, so the true overlap is a little higher. The Showcase and PITCH comparison uses the same match, restricted to speakers in sessions on the Startup Showcase track or in PITCH format; 452 and 95 startups matched, none in both.
First names. The first word of the profile name, after titles such as Dr or Prof. Spellings count separately, so João and Joao are different names, as are José and Jose. Each country’s most common name uses countries with 150 or more attendees.
Raised against revenue. Both are self-reported tags. Startups that ticked “No funding to date” and no raised band count as none; the 203 that ticked both it and the $0 to $250,000 band are counted in the band. 1,513 startups gave a revenue band and a funding answer.
Bio dialects. For each country with at least 250 bios in English, every word used by at least 12 of its attendees, scored as the share of that country’s bios containing it divided by the share of everyone else’s. The chart shows hand-picked words from each country’s top dozen, leaving out place names, demonyms and Portuguese. 396 bios, mostly Brazilian, were in Portuguese and are left out.
What’s not in here. The directory is opt-in, so 21,838 is a large slice of the audience, not all of it, skewed towards people who want to be found. Revenue and funding are self-reported, and a third of startups left them blank. “Stage sessions” means keynotes, firesides, panels, masterclasses, talks, podcasts, press conferences, Q&As and pitch rounds; meetups, stand events, Night Summit and receptions are counted separately.
What we’re not publishing. The participant table is personal data about real people. We use it to decide who to talk to, report it only in aggregate, and won’t release it or list it in our public datasets. The company and programme tables are business data; ask and we’ll share them.
Who did what. Jason collected the data and keeps it current. Claude, Anthropic’s model, did the counting and drew the charts from the exports. Paul chose what was interesting and wrote the words around it.
For readers who got this far
Want the tables?
The exhibitor and programme tables are business data and yours for the asking: 2,910 companies with tier, industry, revenue band, markets, team and website, and 1,153 programme entries with speakers, stages and times. Book a slot or find Paul in the Web Summit app.
And if it’s your own directory, marketplace or event you want read on a schedule, the Fork button on the pipeline at the top of this page takes you to Jason with this brief filled in. See you in Lisbon.
Header photo: Centre Stage before Web Summit 2023, by Web Summit, CC BY 2.0